Impacts of Periodical Cicada Egg Laying on Young Trees in the District of Columbia and Limitations of Using Remote Sensing Products to Assess Their Damage
Background
The periodical cicadas of Brood X (Hemiptera: Cicadidae) emerged in the summer of 2021, shortly after several thousand trees were planted throughout the District of Columbia, USA, during 2020 to 2021. There was concern that the millions of cicadas would negatively impact recently planted trees. This presented an opportunity to assess the impacts of periodical cicadas on an urban tree planting program.
Methods
Newly planted trees were surveyed, with field inspections and remote sensing techniques, for evidence of cicada egg laying and twig damage related to tree genus and location within trees and throughout the District.
Results
There were significant differences in egg-laying behavior among 10 tree genera, with the most damage observed in Acer and Nyssa. Egg laying occurred most often in scaffold and lateral branches. Egg-laying intensity was positively correlated with percent foliage lost. There was little evidence of cicada impacts on tree health as tree condition was unrelated to egg-laying intensity. Survival of the 2020 to 2021 tree cohort was similar to previous years without a large-scale cicada emergence. Remote sensing was unsuccessful in differentiating cicada caused damages from other damage.
Conclusions
Municipal urban forestry departments facing a large periodical cicada emergence may continue tree planting campaigns and avoid damage to new trees by choosing less preferred genera. Although useful, remote sensing products are not currently at the point where a non-remote sensing specialist can acquire and utilize these tools for identifying cicada damage. Field surveys are recommended for accurate delimitation of cicada activity in urban settings.
Introduction
During the summer of 2021, the District of Columbia, as well as adjacent states in the Mid-Atlantic, experienced the emergence of periodical cicadas from Brood X (Oldland and Turcotte 2017; Kritsky 2021). The District of Columbia was inundated with millions of cicadas in parks and neighborhoods, but also in the news with warnings of a new “plague,” one comprised of large, screaming insects. Most District community members were put at ease to learn that cicadas are only interested in mating, do not bite, and, though they feed on trees as adults, appear to do little damage in the process (Dybas and Lloyd 1974). However, their egg laying was a point of concern among arborists and residents, particularly regarding young trees. The prevailing message from extension offices and local experts was to avoid planting trees during a periodical cicada emergence year (Day et al. 2021) or to cover newly planted trees with protective netting that would exclude egg-laying females (Raupp 2021). Excluding cicadas from access to young trees with netting has proven effective (Frank 2020). However, this was of little help to urban foresters in the Mid-Atlantic engaged in ambitious tree-planting campaigns, such as those outlined in the Keystone Ten Million Trees Partnership (Ten Million Trees 2018). The District of Columbia’s Urban Forestry Division (UFD) was one such municipal department and, at the time of the 2021 Brood X emergence, had planted over 8,000 trees during the 2020 to 2021 planting season (District Department of Transportation 2025). The District’s UFD primarily plants trees along the streets in right of way, with additional trees planted in public parks and schools. In this study, the majority of sample trees were planted along streets (approximately 87%) with other trees planted in public parks and schools (9%) and the remaining trees planted in other public spaces. Protecting more than 8,000 trees with netting was not realistic as some trees reached heights of 6 to 8 feet (1.8 to 2.4 m), nor was it economically feasible. Presented with this impending challenge, there was an interest in understanding the impacts of periodical cicada activity on newly planted trees and determine if any particular species or genera of tree were preferred or more susceptible to damage. Understanding such impacts can be used to guide tree plantings in other areas of the country during large emergences of the 13- or 17-year periodical cicadas.
Brood X periodical cicadas are comprised of 3 species: Magicicada septendecim (L. 1758), M. cassini (Fisher 1851), and M. septendecula (Alexander and Moore 1962), all with a 17-year life cycle. Periodical cicada nymphs spend the majority of their lives underground feeding on plant roots until they emerge en masse to molt into their adult phase to find mates and reproduce (Williams and Simon 1995). Adults are active for approximately 4 to 6 weeks (Williams and Simon 1995) and during the Brood X emergence in 2021, adults were observed from April through June (Kritsky 2021). Magicicada spp. adults aggregate in trees for courtship and mating, where males produce loud calls attracting both males and females prompting females to click their wings in response to initiate mating (Cooley and Marshall 2001). Karban (1981) found that periodical cicadas rarely fly distances greater than 50 meters, as they are weak and clumsy fliers and there is such a high incidence of potential mates in any given location that there perhaps is no need to fly far. Periodical cicadas live approximately 4 to 6 weeks as winged adults (Williams and Simon 1995). During that time, 8 to 16 day old females lay eggs in pencil-sized twigs in a variety of species of host trees (Smith and Linderman 1974; Williams and Simon 1995). Females use their ovipositor to slice open the stem and insert approximately 20 to 30 eggs (Forsythe 1976; Williams and Simon 1995), creating a small egg nest. Egg laying creates an injury in stems, resulting in a visible wound and subsequent scar (Williams and Simon 1995; Miller and Crowley 1998).
Periodical cicadas may negatively impact trees through their nymphal feeding on roots, females ovipositing on stems and twigs, or the introduction of pathogens associated with egg laying (Williams and Simon 1995). Excessive egg-laying behavior causes twig dieback at locations of oviposition scars. Oviposition scarring can restrict movement of phloem and xylem solutions and increase the occurrence of decay in branches long after cicada emergence, based on each trees’ individual ability to compartmentalize decay. There is some evidence of reduced growth in individual tree species subsequent to a periodical cicada emergence year (Speer et al. 2010), presumably due to egg-laying behaviors. However, other studies indicate minimal impacts of cicada oviposition behavior on long-term growth in trees (Clay et al. 2009a) or on forest dynamics (Cook and Holt 2002).
Oviposition behavior is influenced by site factors such as forest patch size (Lloyd and White 1976; Cook et al. 2001) and sunlight exposure (Yang 2006) where, cicadas preferentially oviposited in trees with the greatest exposure to light. Yang (2006) suggests that such oviposition preferences may be explained by potential physiological benefits for adults in predator avoidance or offspring with respect to development, or more likely that well-lit trees are an indirect indicator of root habitat quality. Trees in canopy gaps and with increased sunlight are associated with greater root growth and root biomass, respectively (Naidu and DeLucia 1997; Sevillano et al. 2016). Ovipositing in trees located in an open canopy environment may benefit offspring as trees with high sun exposure present greater habitat quality among roots. More broadly, distribution of cicadas may be impacted by conditions of the urban environment such as soil compaction due to difficulties related to burrowing (Moriyama and Numata 2015) or urban heat island effect, demonstrated by greater cicada densities with higher temperatures (Nguyen et al. 2018).
When female cicadas oviposit in small branches and twigs a common sign of damage is called “flagging” (White 1981). Flagging occurs when physical damage causes the twig to break and bend but remain hanging on the tree (Figure 1). The vascular cambium and phloem are disconnected in these two pieces of the branch, and the leaves will die and lose their green coloration. Branches full of dead brown leaves will often be left in the tree canopy for the remainder of the summer after a cicada emergence. This flagging can be seen in ground, drive-by, and aerial surveys.
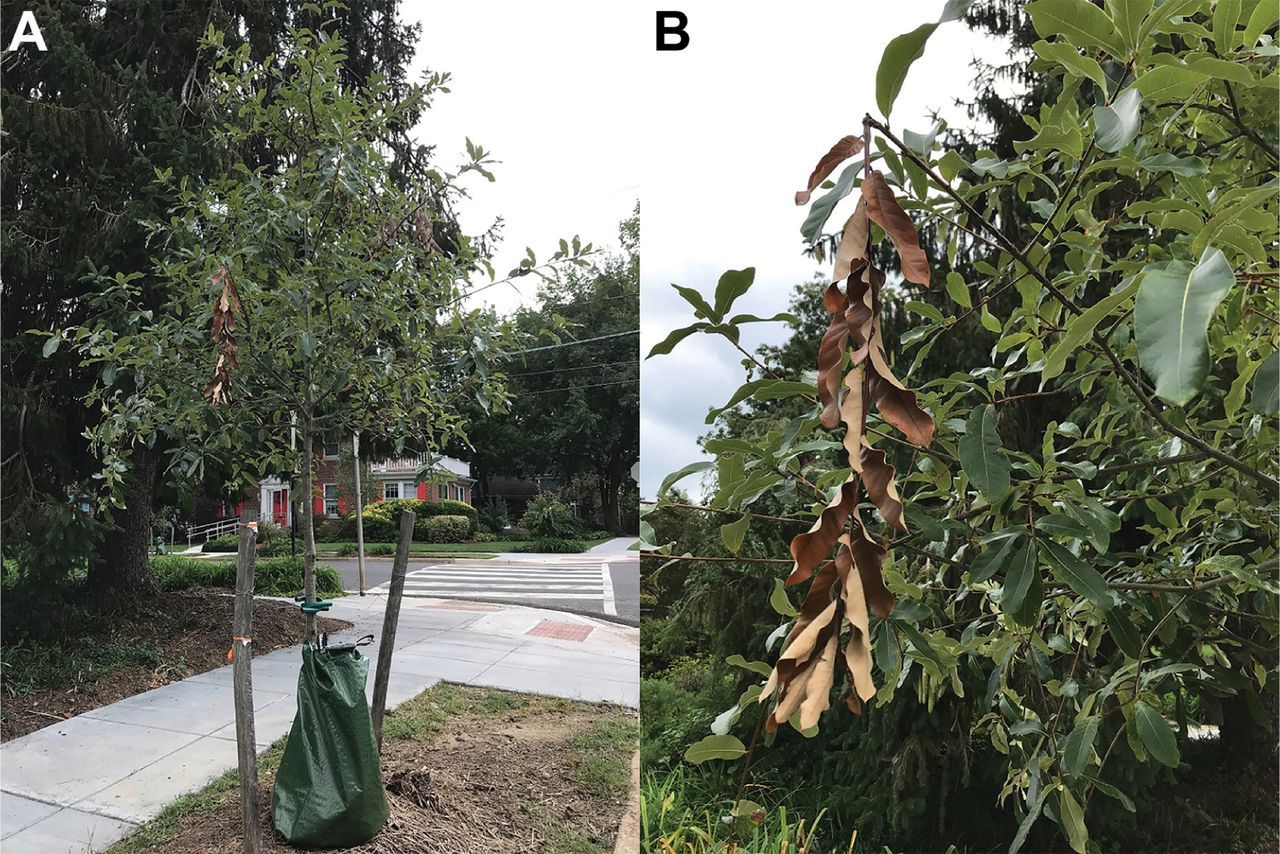
Figure 1.
Flagging and dieback in (A) shingle oak street tree (Quercus imbricaria) and closeup (B) showing flagging in the District of Columbia.
Large emergences of adult periodical cicadas allow for an ideal survey of insect activity because the flagging damage they cause produces a unique defoliation pattern and is visible to observers on site and via remote sensing, while also occurring at predictable intervals and time of the year.
The Brood X cicada event presented an opportunity to utilize USDA Forest Service remote sensing resources for monitoring landscape level forest disturbance. This project utilized several remote sensing products including ForWarn II’s near-real-time forest disturbance monitor (Norman et al. 2013), high-resolution forest mapping (HiForm) 10 m pixel (10-m2 cell) change detection (Norman and Christie 2022), and high-spatial resolution satellite (WorldView 2) image interpretation. ForWarn II has readily available coarse resolution 232-m pixel (232-m2 cell) change detection products and was the logical first choice in trying to assess large-scale forest change, while the high-resolution forest change detection product (HiForm), which utilizes 10 m Sentinel-2, was requested from the Southern Research Station Threat Assessment Center (Asheville, NC, USA) and has a cell size that approximates the footprint of a single large canopy tree (Norman and Christie 2022). High resolution satellite imagery was requested from the Remote Sensing Application Center (RSAC)(Salt Lake, UT, USA). The imagery RSAC provided was WorldView-2 imagery which provides commercially available panchromatic imagery of 0.46-m resolution, and 8-band multispectral imagery with 1.84-m resolution, representing one of the highest available spaceborne resolutions on the market.
Both change detection products (ForWarn and HiForm) use satellite imagery to produce maps of the Normalized Difference Vegetation Index (NDVI) values that compare current to historical NDVI values to identify change (Norman and Christie 2020; Pontius et al. 2020). The NDVI is a widely used index that compares the red and near infrared spectral bands, available on most multispectral satellite systems, to measure the vigor, or “greenness,” of a pixel (cell) and thus measure the impact of environmental and biotic factors on vegetation (Norman et al. 2013). Changes in greenness are then used to determine or identify changes to tree health. High-spatial resolution satellite imagery is primarily available from private satellite companies such as Maxar and Planet. Products vary in spectral, spatial, and temporal resolutions.
This study describes a survey of Brood X periodical cicada damage on a young tree cohort of varied species in 2021 and also incorporates inspections of newly planted trees carried out by Urban Forestry Division staff. The USDA Forest Service applied remote sensing to quantify damage done to mature street trees. The objectives were to (1) assess the impact from cicada egg laying on newly planted trees through field inspections, and (2) determine the effectiveness of utilizing remote sensing to detect periodical cicada damage on urban street trees.
Materials and Methods
Site Description
The Urban Forestry Division (UFD) manages approximately 200,000 publicly owned trees. These trees are located in the public right of way and in public schools and parks. Tree species, size, date planted, and other data are stored and continuously updated in an open access geodatabase using ArcGIS Online, Pro, and Collector (Esri, Redlands, CA, USA). Information for this project was accessed on or before 2023 April 6.
Field Inspections
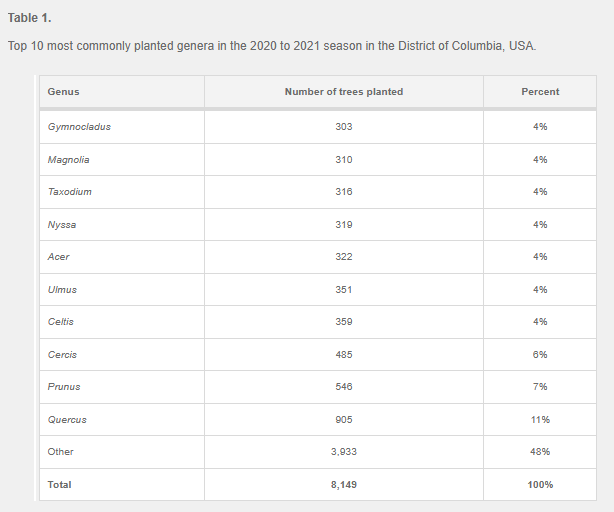
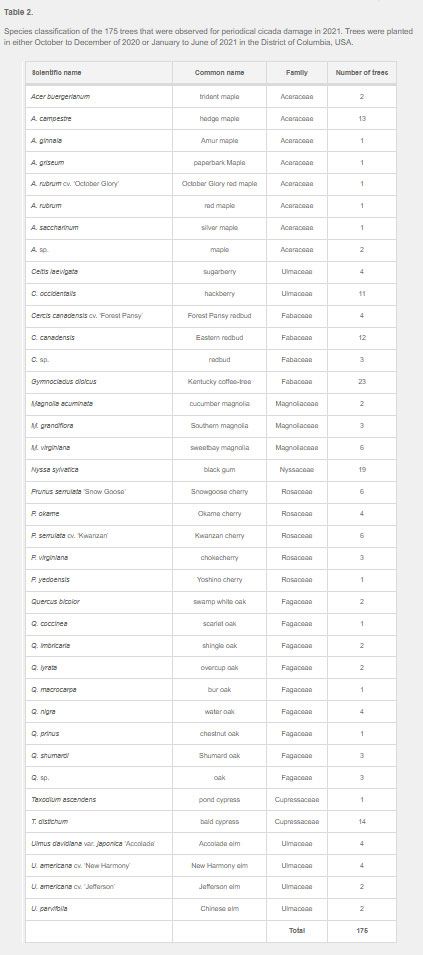
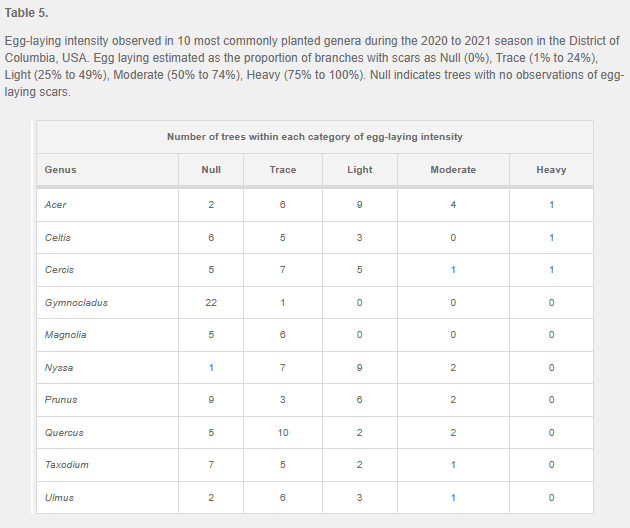
The UFD planted 8,149 trees beginning on 2020 October 5 until 2021 May 18. During the 2020 to 2021 planting season, planted trees were comprised of 149 species and cultivars, where no individual species or cultivar made up greater than 4% of all trees planted. “Planting season” refers to the years that trees were planted. For example, the “2020 to 2021 planting season” covers the span of the autumn of 2020 through the winter to the end of spring in 2021. Due to high species richness among newly planted trees, many species were represented by just a few individuals. To ensure large enough samples sizes in statistical analysis, trees were tallied by genus rather than species. Only the top 10 most commonly planted tree genera were chosen for the survey. These genera were Acer, Celtis, Cercis, Gymnocladus, Magnolia, Nyssa, Prunus, Quercus, Taxodium, and Ulmus. Each of these genera comprised between 4% to 11% of the total genera planted during the 2020 to 2021 planting season (Table 1). These 10 genera represented 52% of the trees planted during the 2020 to 2021. Of these 10 genera, a random sample of 30 individual trees were selected using ArcGIS Pro. Due to limitation on staff time, 175 out of the 300 randomly selected trees were surveyed over 10 days throughout a 2-month sampling period during the periodical cicada emergence. In short, during the late summer of 2021, the impact of periodical cicada was assessed on 175 newly planted trees planted during the 2020 to 2021 planting season that comprised of 10 genera (Acer = 22; Celtis = 15; Cercis = 19; Gymnocladus = 23; Magnolia = 11; Nyssa = 19; Prunus = 20; Quercus = 19; Taxodium = 15; and Ulmus = 12) within 7 families (Table 2).
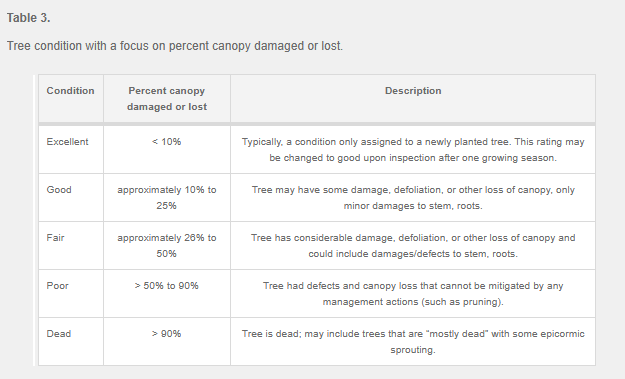
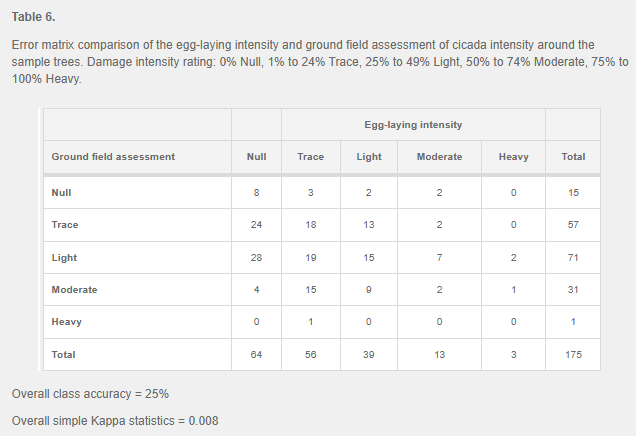
Each tree surveyed was first inspected for standard tree inventory data collected by District Urban Foresters, such as tree condition, size measured as diameter at breast height (DBH), and date of inspection (Table 3). Tree condition was defined broadly based on a combination of criteria that include condition of the stem and branches, aboveground roots, and crown vigor. Cicada survey data were collected by the District Forest Health Coordinator using Arc-GIS Collector (iOS app version 21.0.4) by slowly walking around the tree, conducting a 360° visual inspection of each tree. Trees were evaluated for percent foliage loss, presence/absence of egg-laying scars, location of oviposition scars (lead stem, scaffold branches, or both), and egg-laying intensity estimated as percentage of branches with oviposition scars: 0% Null, 1% to 24% Trace, 25% to 49% Light, 50% to 74% Moderate, and 75% to 100% Heavy.
Observations of oviposition scars were described as located on lead or scaffold branches. The lead refers to the “leader,” an upright stem that dominates growth (Lilly et al. 2019). Oviposition scars located on other lateral or scaffold branches were referred to as “located on scaffold branches.” Location of oviposition scars on individual trees was assessed because the impact of cicada damage on the leader could be greater compared to the impact on scaffold branches due to apical dominance growth patterns in some tree species. Data were collected on the following dates: 2021 August 3, 23, and 25, and September 2, 7, 10, 16, 22, 24, and 29. The sampling dates were selected to occur after peak egg-laying periods for the periodical cicadas so well-developed damage would be observable.
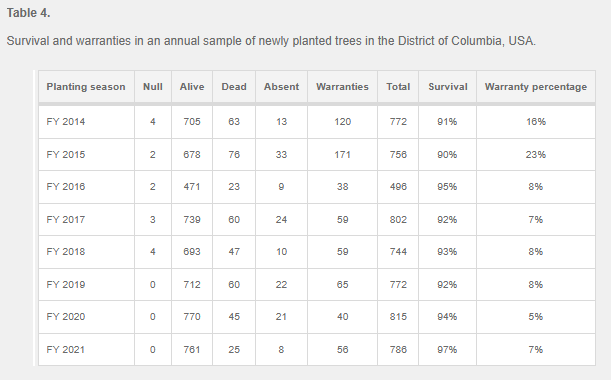
Because the trees used in this trial were located in different parts of the city with different habitats, and a complex mix of private and public ownership, we used a visual ground field assessment “line of sight” method to estimate cicada activity in the area around the individual tree. This was accomplished by estimating the percentage of visible trees showing cicada damage (flagging): 0% Null, 1% to 24% Trace, 25% to 49% Light, 50% to 74% Moderate, and 75% to 100% Heavy in a 360° arc around the tree. The Urban Forestry Division’s annual evaluation of newly planted trees was used to compare survivorship of trees the year of cicada emergence to previous years. Urban Forestry Division inspects newly planted trees immediately after 1 growing season, and 1 year later (after 2 growing seasons). The first inspection of newly planted trees confirms that trees are in Good or Excellent condition (Table 3) by District Urban Foresters. Any trees identified with a condition of Fair, Poor, or Dead are replaced per the tree planting contract. Such trees require a warranty replacement; this is reflected in Table 4. After 2 growing seasons, a sample of newly planted trees (approximately 10%) are evaluated for survival, condition, and several traits related to the urban environment. Additionally, observations of pest and pathogen presence are evaluated per the i-Tree Inventory and Pest Evaluation Detection (IPED) protocol (USDA Forest Service 2010). Newly planted trees are evaluated after 2 growing seasons. For example, the tree cohort planted between October 2020 and April 2021, just prior to the emergence of Brood X, were evaluated for survival in the fall of 2022. A total of 786 trees were evaluated, out of 8,149 planted between 2020 to 2021. The 786 trees evaluated consisted of the following sample sizes for each of the 10 genera referenced above: Acer = 39; Celtis = 26; Cercis = 48; Gymnocladus = 23; Magnolia = 28; Nyssa = 44; Prunus = 68; Quercus = 78; Taxodium = 33; and Ulmus = 38. Survival and condition of these 786 trees in fall 2022, after Brood X, was compared to survival rates from previous years. Occasionally, upon inspection, trees are missing from the planting location; these trees are identified as “Absent” in the survival study (Table 4).
Remote Sensing
ForWarn II: The initial assessment of landscape level cicada damage in the District was done using the ForWarn II online mapper system (Norman and Christie 2022). ForWarn II currently uses European Space Agency’s Sentinel-3 imagery for tracking change in the Normalized Difference Vegetation Index (NDVI). Products are at 232-m spatial resolution (13.3 acres or 5.4 hectares). ForWarn II uses a historical NDVI database from 2000 to the present to compare baseline data to current NDVI values (Norman and Christie 2022).
High-Resolution Forest Mapping (HiForm): HiForm is an online application that maps forest change utilizing Google Earth Engine and 10-m Sentinal-2 imagery and the NDVI to calculate change (Norman and Christie 2022). The HiForm product used in this study was received directly from the Southern Research Station, and there was no additional processing or production of the files by the authors. The Southern Research Station used Surface Reflectance adjusted 10-m Sentinel 2 NDVI products. The 10-m high-resolution NDVI data layer from the Southern Research Station was filtered using the District of Columbia’s Department of Transportation, Urban Forestry Division’s tree canopy layer to eliminate areas that were not covered by tree canopy. The NDVI for the peak period of branch flagging (July to September 2021) was compared with a baseline of the highest NDVI for the same time from the previous 2 years. The threshold to target the level of change to the signature was adjusted to the desired threshold range of −5% to −15% lower NDVI (S. Norman, personal communication). The reasoning for this was that less than 5% is too subtle a reduction and may not mean anything and a greater than 15% reduction may represent a more drastic change like tree removal or death within a pixel. This layer was further simplified to presence/absence for NDVI change; cells falling within the −5% to −15% range were classified as NDVI change present and all others were classified as no NDVI change present.
Scan and Sketch Assessment: This portion of the study aimed to assess the ease of obtaining high spatial resolution imagery and attempted to digitize these products on GIS software. No statistical comparisons were made using this method. Satellite imagery data were downloaded for the period of peak cicada impact from various sources including Worldview-2 and Sentinel-2 databases (USDA Forest Service Remote Sensing Applications Center, Salt Lake City, UT, USA). Cloud free digital color images were processed using a “scan and sketch” approach within ArcMap ArcGIS 10.2 software, while using high-resolution imagery. This is meant to mimic an aerial detection survey (McConnell et al. 2000) by allowing the user to “move” across the image and digitize areas of perceived damage on a computer screen as opposed to from a low-flying airplane. This period of peak impact occurred starting in late July and ran through late September 2021. Percent affected was used as the attribute to map in the program. The resulting polygons were then classified (Hanavan et al. 2022) and attributed to mimic current USDA Forest Service national reporting standards (USDA Forest Service 2022). For this project, a single surveyor did all the digitizing to minimize bias between surveyors, and a polygon was assigned a value based on the percentages of damage (percent affected).
HiForm vs Field Inspection: To compare the ground field assessment of cicada intensity around the sample trees to the HiForm detected change product, we created polygons that approximated the area of what the on-the-ground field technician saw when doing their assessment. Google Earth Engine’s (EE) Google Street View (leaf on) imagery from the vantage point of the sample tree was used to create a cicada damage intensity (DI) 3D-polygon of the visible area (line of site) around each individual survey tree as seen by the observer. Although the Google Street View imagery varied by location and time taken, we tried to use, when possible, the closest month available to the actual cicada injury month (July 2021). The resulting damage intensity polygons were then superimposed over the NDVI layer and the damage intensity for that polygon was calculated as the number of pixels designated as having cicada damage (positive for −5% to −15% reduction in NDVI) over the total number of pixels in the polygon and then categorized. Polygons were classified using the same categories as the field assessment. These data were then used to formulate an error matrix (Johnson and Ross 2008; Campbell and Wynne 2011).
Statistical Analysis
The impact of periodical cicada emergence on newly planted trees was analyzed using Statistica 13.5.0.17 software (TIBCO Software Inc., Palo Alto, California, USA). We used ordinal regression and ordinal logit model because the data did not meet the assumptions of normality or homogeneity. Means of significant effects were then compared with Tukey’s contrast test. Ordinal regression analysis was used to calculate the relationship between egg-laying intensity (dependent variable) with DBH, planting year, foliage loss, and ground field assessment of cicada intensity around the sample trees, separately. Ordinal regression was also used to estimate the relationship between tree condition (dependent variable) with egg-laying intensity, ground field assessment of cicada intensity, tree DBH, and planting year, separately. Egg-laying intensity, egg-laying location, foliage loss, and tree condition were used to determine the impact of periodical cicada damage on tree genera using ordinal logit model. Trees without cicada damage were excluded from the egg-laying location analysis. All dependent variables had an ordinal distribution, and independent variables were categorical such as tree genus or continuous such as DBH. Multiple linear regression models were not used, eliminating issues of multi-collinearity.
Kappa statistics was used to quantify the level of agreement between egg-laying intensity and ground field assessment of cicada intensity around the sample trees in SAS (SAS®, version 9.4, SAS Institute Inc., Cary, NC, USA). The simple kappa coefficient, K, (Cohen 1960) is a measure of interrater agreement, where the row and column variables of the 2-way table are viewed as 2 independent ratings. When there is perfect agreement between the 2 ratings, the K coefficient is +1. When the observed agreement exceeds chance agreement, the value of K is positive, and its magnitude reflects the strength of agreement. The minimum value of K is between −1 and 0, depending on the marginal proportions (SAS System Documentation).
The error matrix follows Johnson and Ross (2008) and contains columns and rows and diagonals to calculate the following statistics: the overall accuracy, omission error, commission error, the consumer’s accuracy, producers’ accuracy. To measure the degree of agreement between the two rating systems (field inspections and NDVI), the kappa statistic and Bowlers’ test of symmetry were calculated using Proc FREQ with the AGREE options in SAS.
Results
Field Inspections
The newly planted trees used in this study (n = 175) had an average DBH of 1.75 inches (4.45 cm)(+/− 0.04 SE). The ordinal regression analysis indicated that egg-laying intensity was not related to DBH (Wald test, X2 = 3.52, df = 1, P = 0.061) on trees that have a range of 0.5 to 2.60 inches (1.3 to 6.6 cm) of DBH, nor the year trees were planted (Wald test, X2 = 0.69, df = 1, P = 0.405). In contrast, egg-laying intensity showed significant differences among tree host genera (Wald test, X2 = 35.15, df = 9, P < 0.001)(Figure 2, Table 5). The impacts of egg laying on Gymnocladus spp. trees (Wald test, X2 = 15.28, P < 0.001) were significantly lower compared to the other genera, with a mean ranking of Null (Figure 2, Table 5). Trees in Acer spp. (Wald test, X2 = 18.02, P < 0.001) and Nyssa spp. (Wald test, X2 = 11.09, P < 0.001) experienced the highest impacts of egg-laying activity, with a mean ranking of Light. Trees in the other 7 genera (Celtis, Cercis, Magnolia, Prunus, Quercus, Taxodium, and Ulmus) showed egg-laying intensities intermediate between Gymnocladus and Nyssa/Acer genera, with the majority of observations showing impacts in the Trace to Light egg-laying intensity. This could indicate that female cicadas prefer ovipositing in some tree genera versus others.
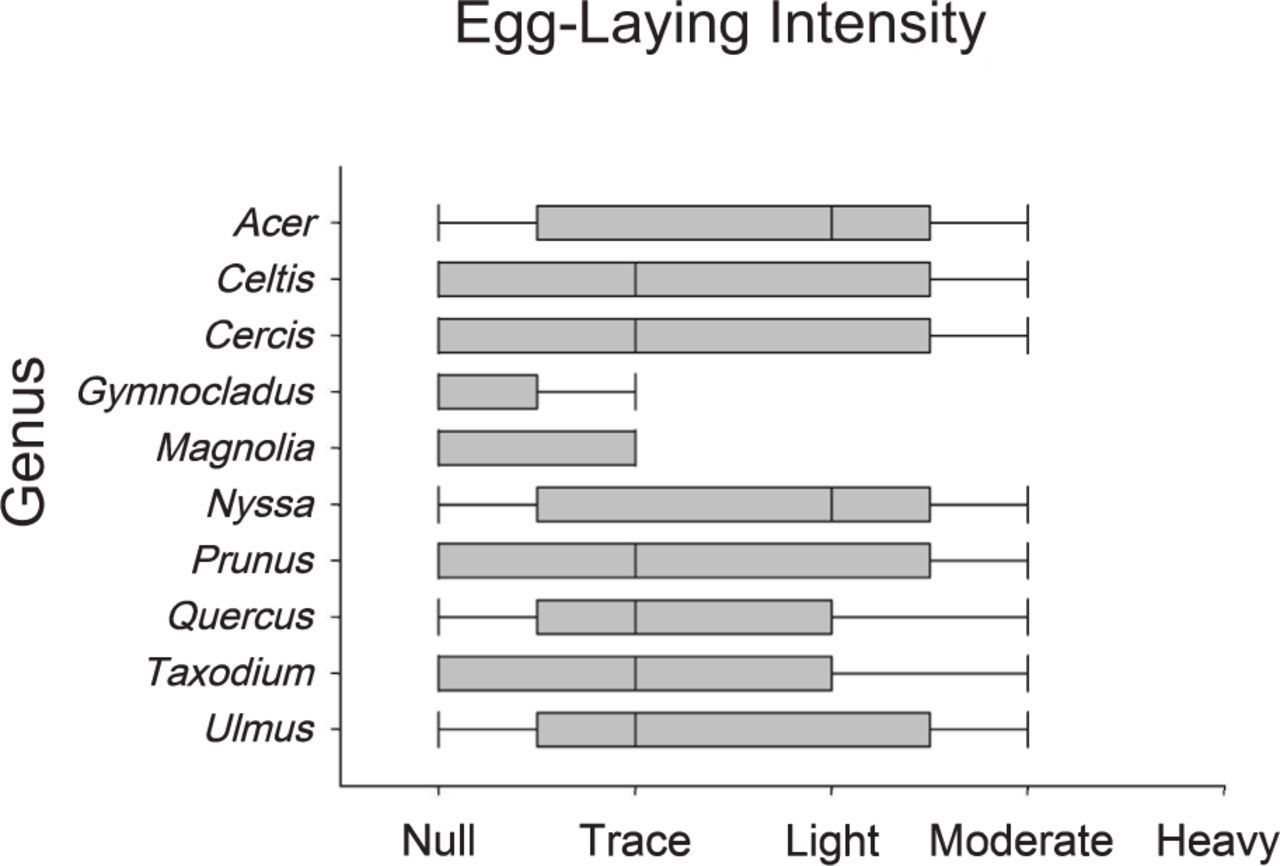
Figure 2.
Egg-laying intensity in newly planted trees by genus. Egg-laying intensity was estimated as 0% Null, 1% to 24% Trace, 25% to 49% Light, 50% to 74% Moderate, and 75% to 100% Heavy (n = 175). The bars indicate the lower and higher confidence interval, the vertical line in the middle of the bar represents the means, and lines extending from the bar represent the minimum and the maximum.
Most sampled trees were located in areas with Trace (31%), Light (41%) and Moderate (18%) cicada damage (Figure 3). In contrast, 9% of sampled trees were in areas with no damage and only 1% in heavily damaged areas. This indicates that the damage a street tree experienced was not related to the estimated cicada damage of the surrounding public or private trees. Indeed, results of the kappa analysis showed that there is no agreement (K = 0.008) between egg-laying intensity and ground field assessment of cicada intensity around the sample trees (Bowker’s test of Symmetry of Disagreement; Chi-Square = 54.85, df = 10, P < 0.001)(Table 6). Similarly, the ordinal regression analysis between the estimated cicada activity in the area (ground field assessment of cicada intensity) around the individual trees and egg-laying intensity was not significantly different (Wald test, X2 = 4.80, df = 4, P = 0.307).
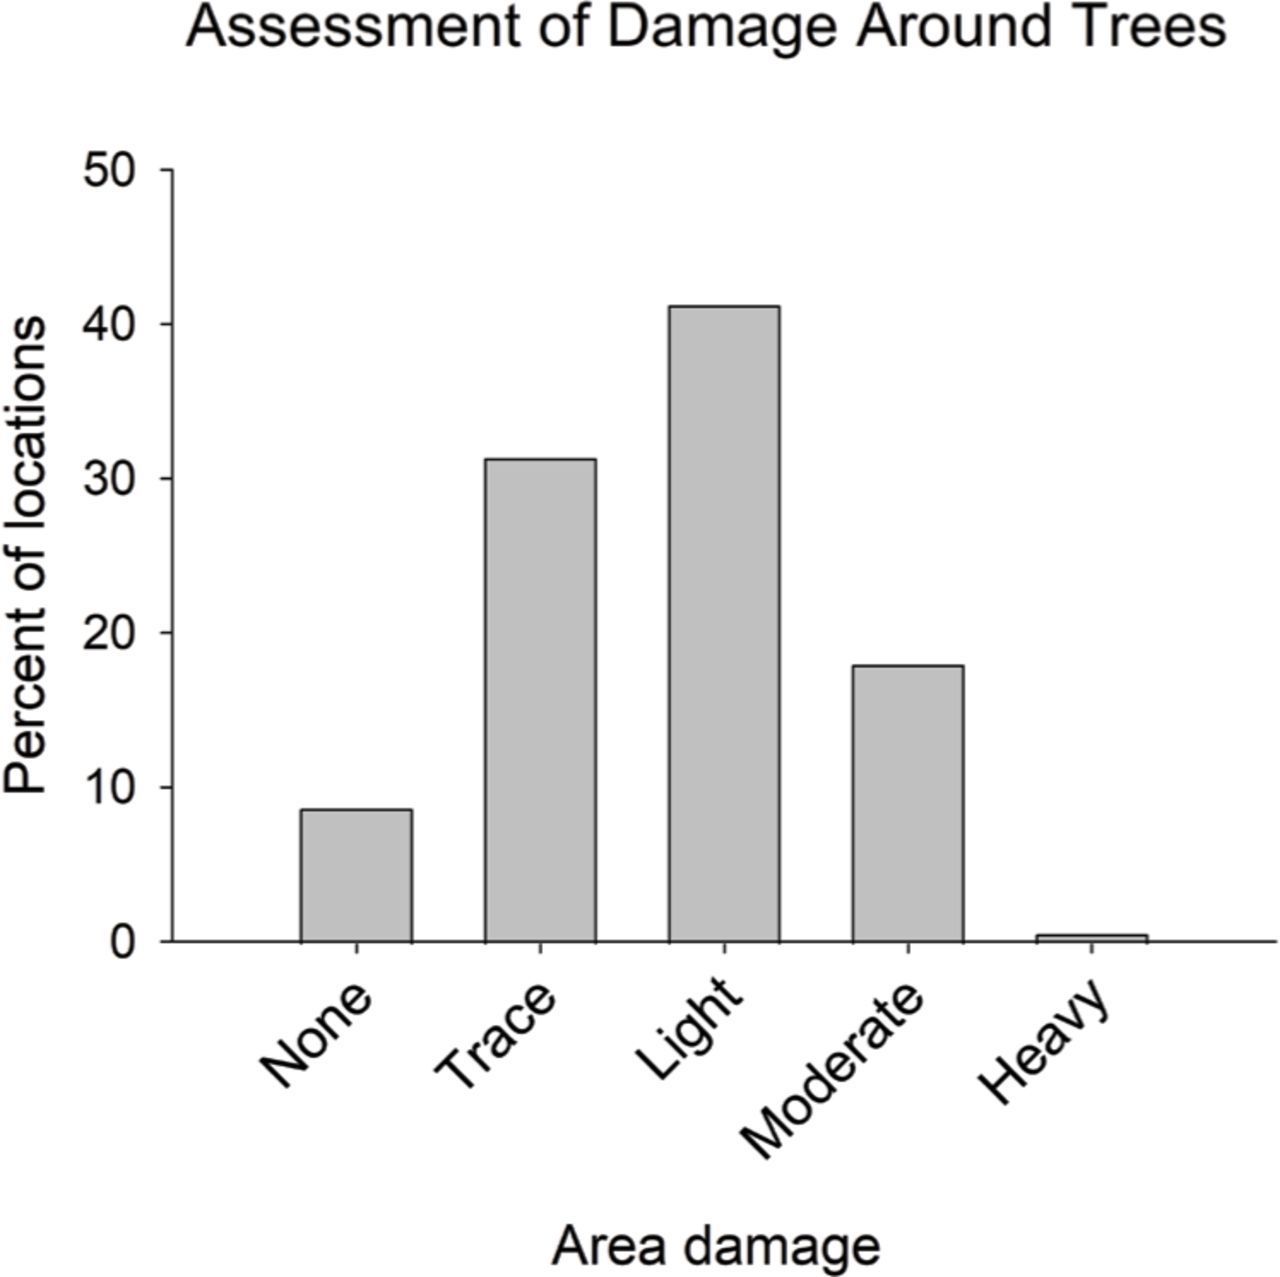
Figure 3.Estimate of damage to nearby trees within sight of each study tree (includes private and publicly owned trees) (n = 175).
This study found that a greater proportion of the trees surveyed exhibited egg-laying scars in scaffold branches than did trees with scarred lead stems. Excluding trees without cicada damage, 77% of trees had cicada damage on the scaffold branches, 1% on the leader and 22% in both scaffold branches and leader. Figure 4 shows all trees surveyed, including those where no egg-laying scars were observed. However, tree genus did not influence egg-laying location (Wald test, X 2 = 0.71, df = 9, P = 0.999).
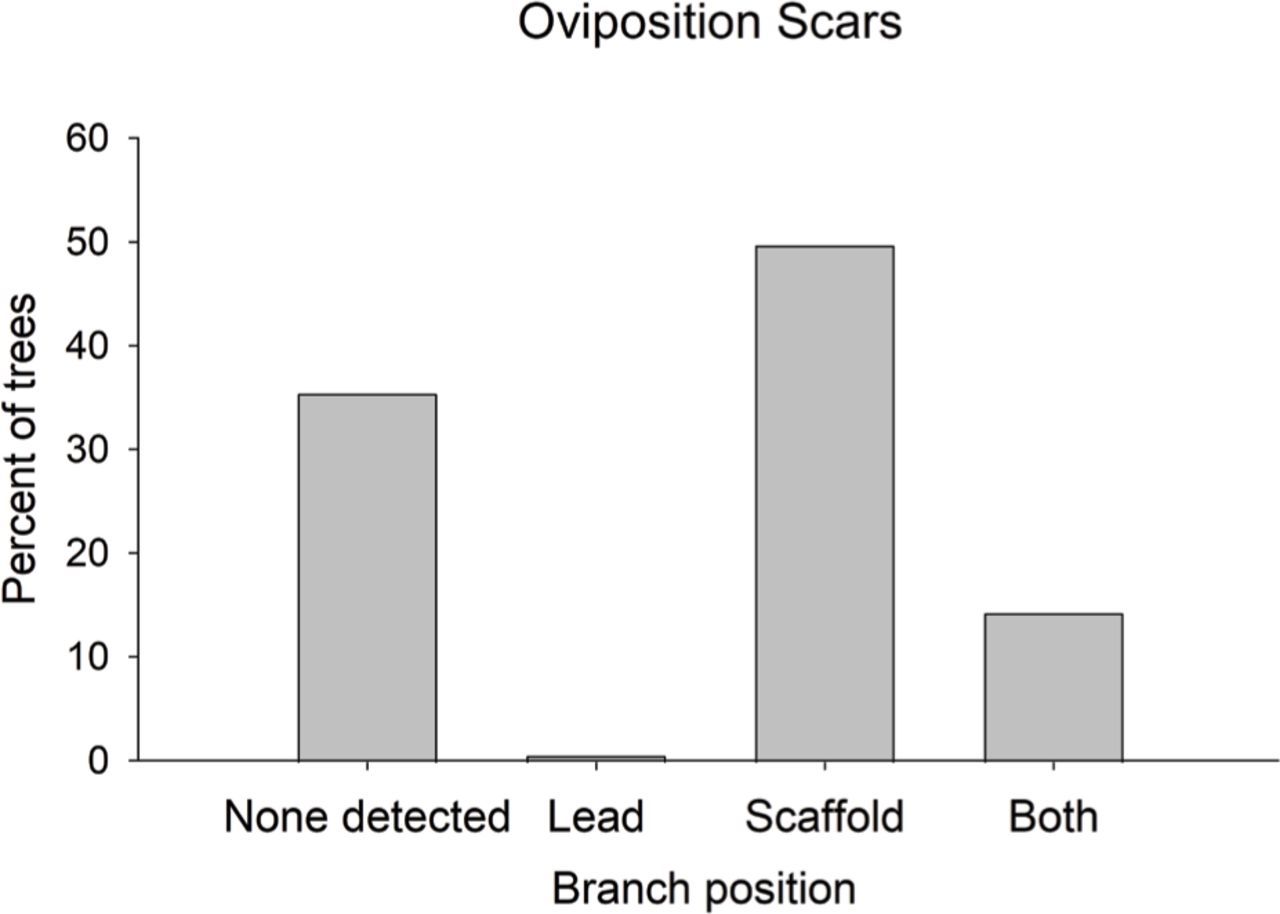
Figure 4.
Percent of tree which had oviposition scars on lead branches, scaffold branches, both branch positions, or no oviposition damage (n = 175).
The percent of foliage lost was low but was significantly different among genera (F = 4.59; df = 9, 160; P = 0.005)(Figure 5). Nyssa had the highest reduction of foliage with an average of 4% of foliage lost followed by Acer with 2%. Foliage lost was statistically similar among the rest of the genera (Celtis 1.33%, Cercis 0.79%, Gymnocladus 0%, Magnolia 0%, Prunus 0.26%, Quercus 1.38%, Taxodium 0%, and Ulmus 0.42%). According to the ordinal regression analysis, egg-laying intensity was related to the percent foliage lost (Wald test, X 2 = 21.79, df = 1, P = 0.005) which indicated that the dieback recorded was caused by the cicada damage during the egg-laying process.
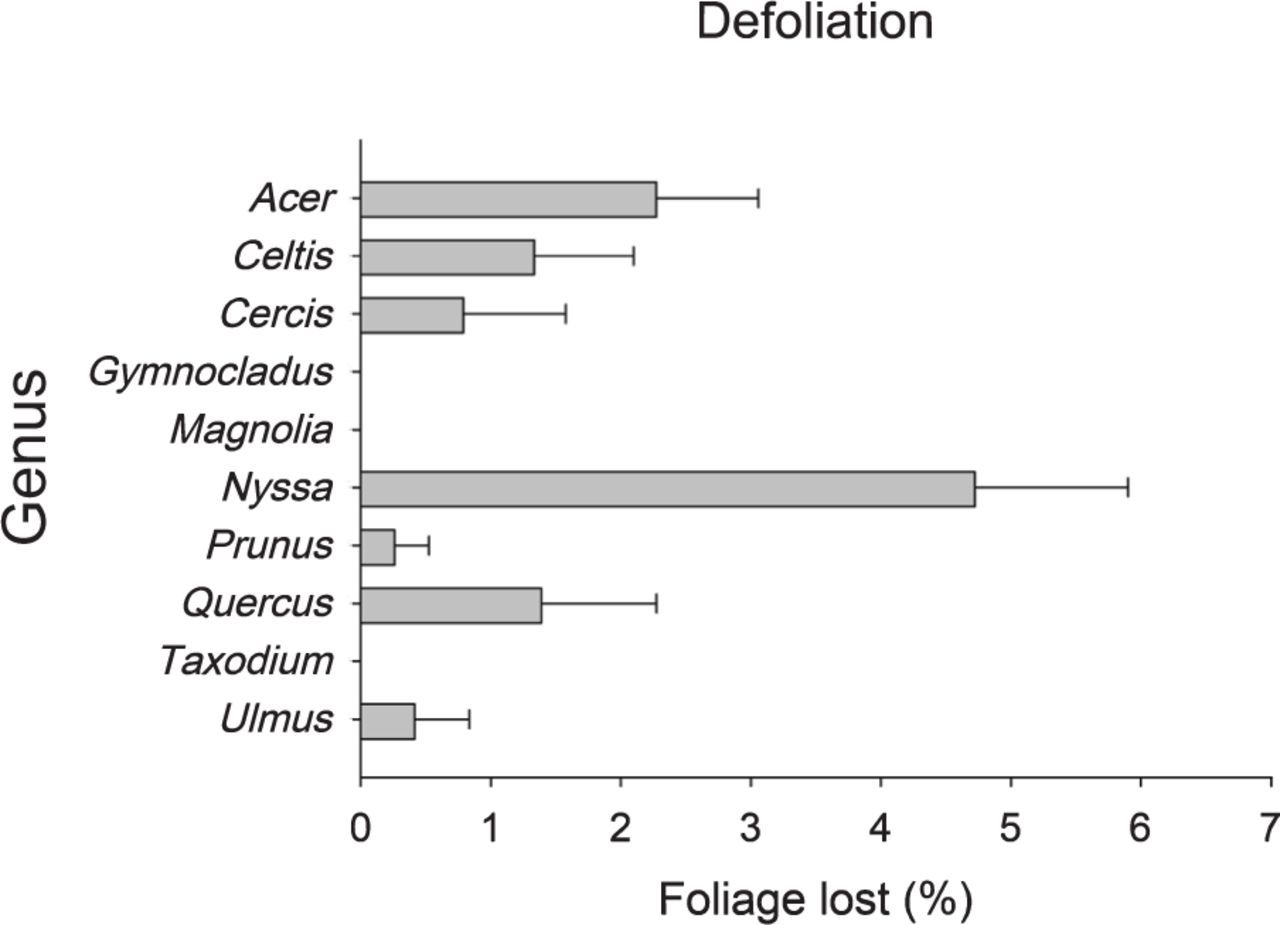
Figure 5.
Estimate of percent foliage lost by tree genus (n = 175).
Although, effect of egg-laying intensity and foliage lost were statistically significant, tree condition was not different among genera (Wald test, X 2 = 9.90, df = 9, P = 0.359). In addition, the data did not show relationships between tree condition with egg-laying intensity (Wald test, X 2 = 6.98, df = 3, P = 0.072), ground field assessment of cicada intensity (Wald test, X 2 = 1.25, df = 4, P = 0.869), DBH (Wald test, X 2 = 0.92, df = 1, P = 0.337) nor the year the tree was planted (Wald test, X 2 = 0.01, df = 1, P = 0.950). Most of the trees were ranked as good (68%) and excellent (20%) in their overall health condition. In contrast, 7% of the trees were ranked fair, 4% poor, and 1% dead. Results from Urban Forestry Division’s annual survival evaluation revealed that after 2 years of growth, trees planted in the 2020 to 2021 season had an estimated survival rate of 97%. This rate was higher than rates in previous years, which ranged from 90% to 95% and average of 92% survival (Table 4).
Remote Sensing
ForWarn II: The District of Columbia is 17,702.6 hectares with each Forwarn II cell covering 5.4 hectares, meaning there are roughly 3,200 pixels (cells) within the District. Although, Forwarn ll did capture change throughout the period of peak cicada activity (July to September 2021); with the maximum departure occurring on the 2021 July 4 to 27 product. During this period the extracted summary values showed only 4.8% of the cells were substantially “browner” than the baselines. As this did not appear to capture the full spatial extent of the cicada damage observed by ground observations and reports (Figure 6), we transitioned to focus on the high-resolution HiForm data.
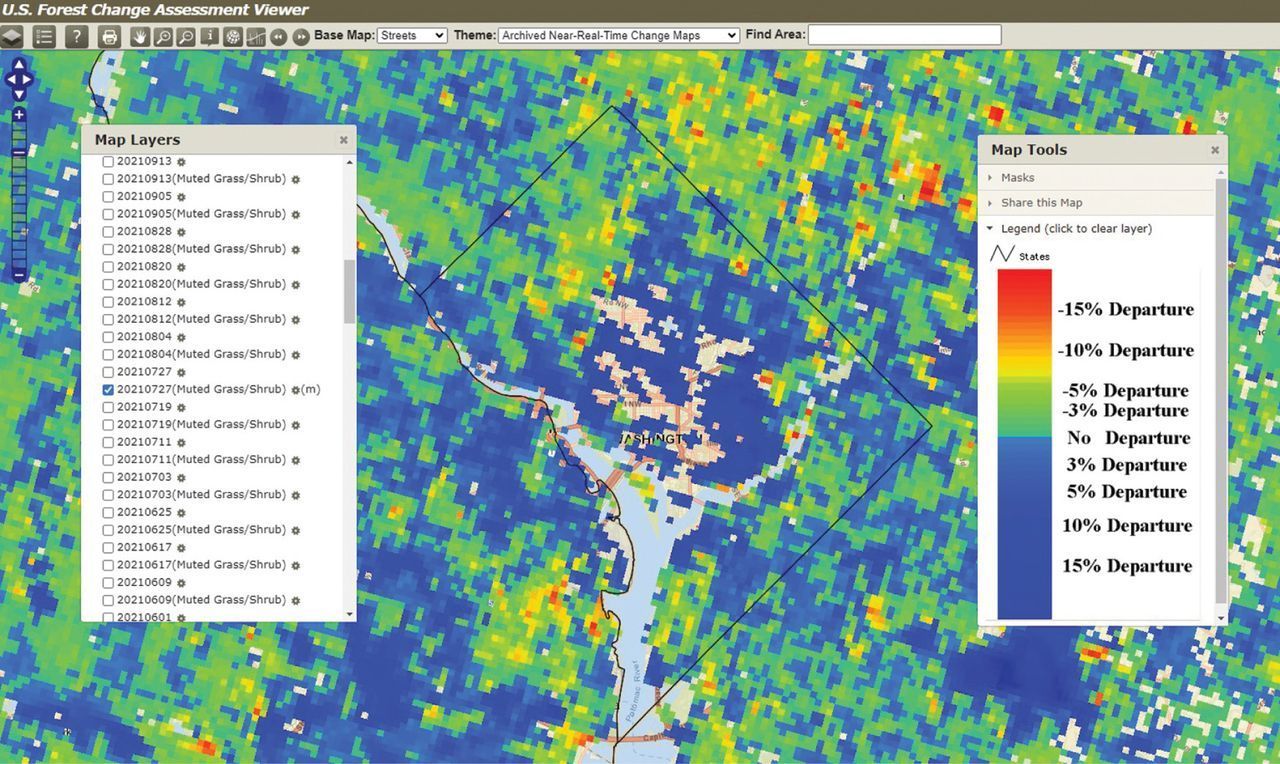
Figure 6.
Screen capture from ForWarn II from the 2021 July 27 cycle for the District of Columbia, in addition to adjacent states of Maryland and Virginia. Resulting map included few larger areas of disturbance when reported cicada damage was widespread.
HiForm: The high-resolution data, with its 10-m pixel cell size, provided more damage locations and better represented field inspection reported cicada damage (Figure 7). The 2021 August 8 change product was chosen as it appeared to best represent the scale and distribution of the cicada outbreak when compared to field observations. In covering the District, this product contained more than 1,493,000 pixels (cells) in which 416,373 pixels (cells) were identified as having change in the recommended range when compared to previous years data (Figure 8). This product appeared to better represent the distribution and scale of the cicada’s activity when compared to field observation and reports.
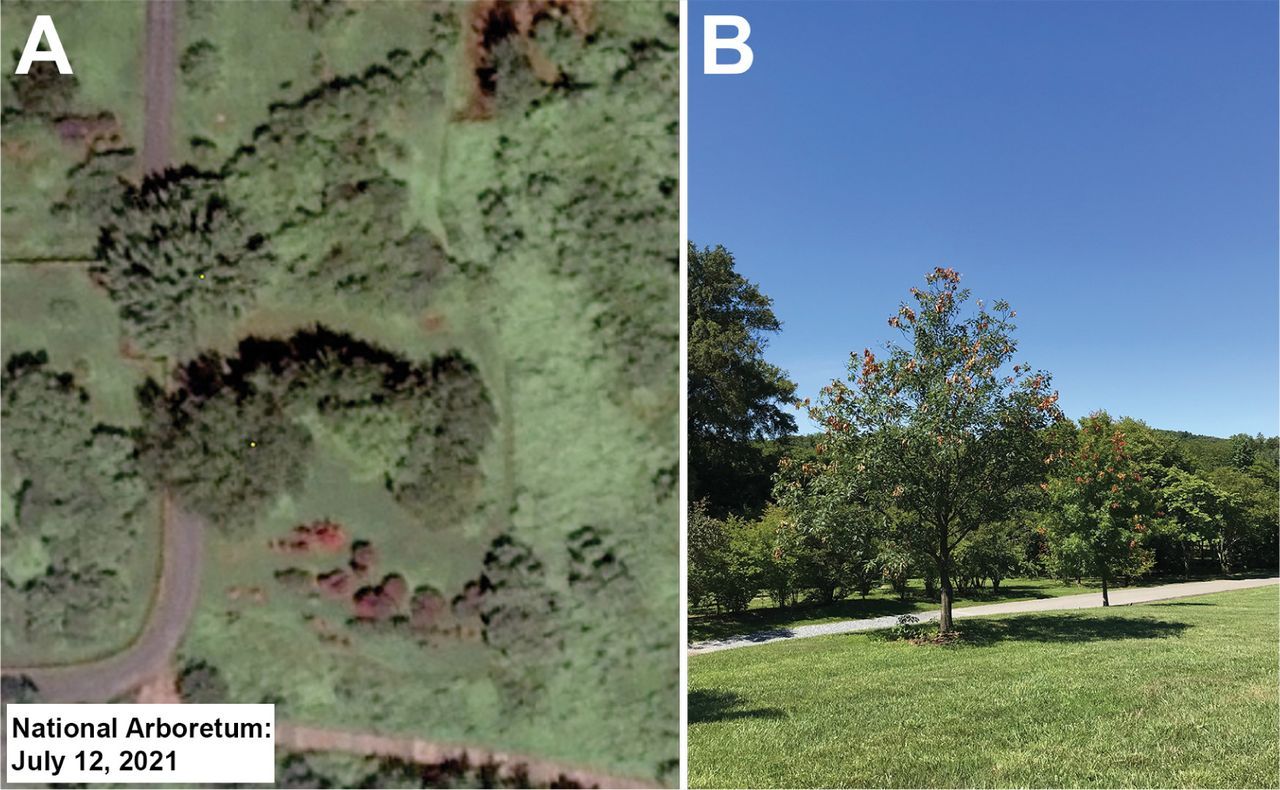
Figure 7.
(A) Cicada damage visible from Worldview-2 satellite imagery at the National Arboretum, District of Columbia in July 2021; (B) ground photo of the trees with flagging symptoms in the National Arboretum taken in July 2021.
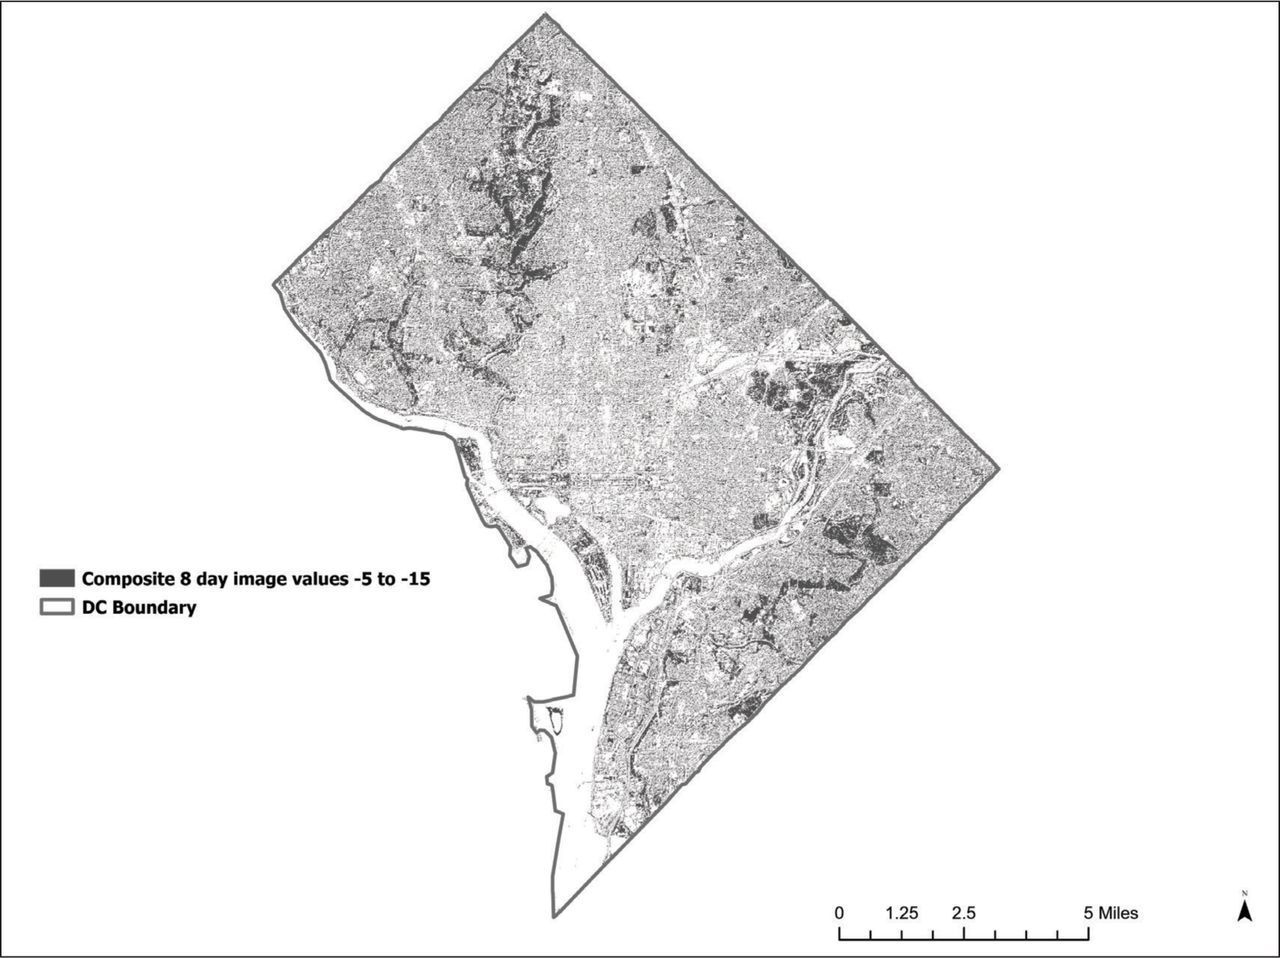
Figure 8.
High resolution (10 m) NDVI data derived image from 2021 August 8th that utilized the target threshold of −5% to −15% reduction in NDVI. Image cut to show 2020 canopy layer for the District of Columbia, and the white areas represent no canopy cover.
Scan and Sketch: High-resolution satellite images were limited due to the infrequency of collection and the need for cloud-free images. Although many platforms (e.g., Sentinel and others) were accessed for high-resolution images, only a single image from July to September 2021 was found to be useful (> 50% cloud free) and that image only covered approximately one third of the District. This was a Worldview-2 image from 2021 July 21. This single image provided enough resolution to view the signature of cicada damage (flagging) for the use of the “scan and sketch” method. This resulted in 144 polygons being mapped and categorized, of which 6% were Light, 31% Moderate, 63% Severe, and none found to be very severe (Figure 9).
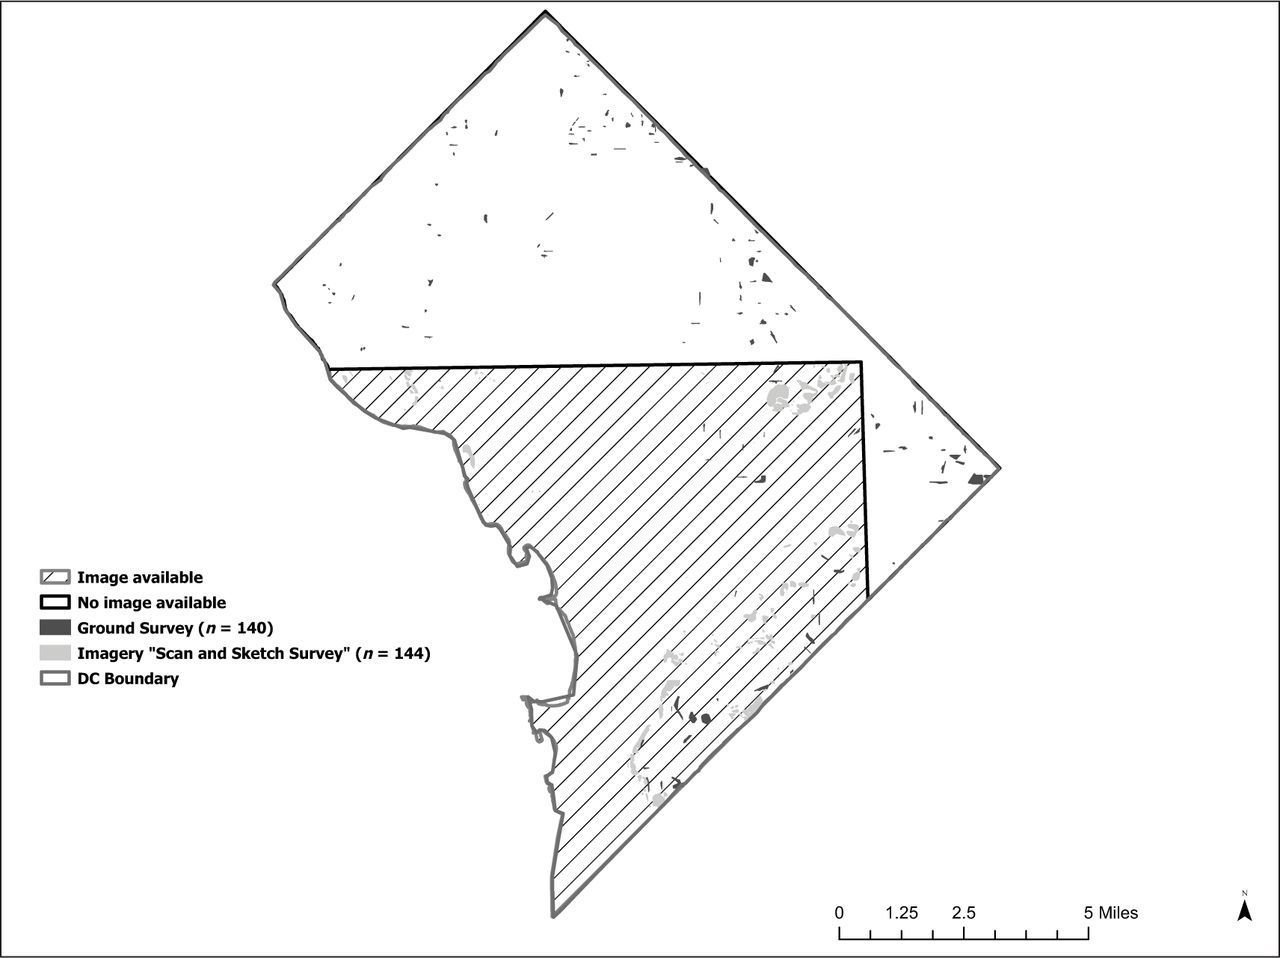
Figure 9.
Results of the ground surveys and the scan and sketch survey methods. Ground surveys were carried out throughout the district while scan and sketch was restricted to areas for which aerial imagery was available.
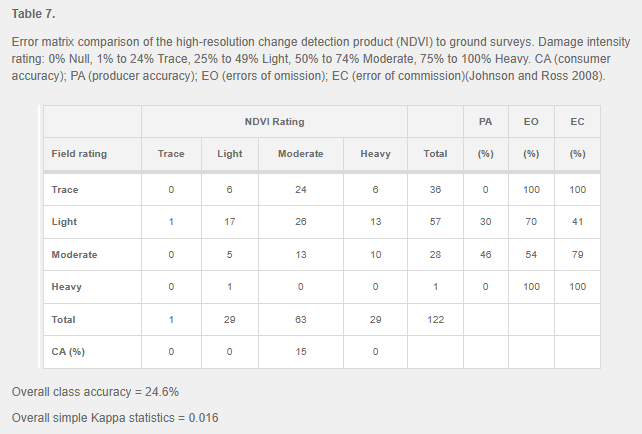
HiForm vs. Field Inspection: The ground field assessment of cicada activity around the 175 individual survey trees produced 140 3-D variable sized polygons (some polygons overlapped with trees on the same street). Digitized intensity (DI) polygons ranged in size from 0.25 to 19 acres (0.1 to 7.7 hectares). The ground field assessment of DI resulted in 18 None, 36 Trace, 57 Light, 28 Moderate and 1 Heavy ground polygon being assessed. In the comparison to the high-resolution NDVI change detection product and the ground field assessment data, the high-resolution (HiForm) NDVI change detection product picked up detectable damage in all the sample areas. As the ground field assessment identified 18 areas without cicada damage, these observations were omitted from the error matrix to make for a symmetrical analysis. These results can be seen in the error matrix of Table 7. The diagonal from the upper left to lower right shows the proportion of correctly classified areas between NDVI and the field inspections. The overall classification accuracy of 24%, with only 30 of 122 areas in agreement. The agreement for the two methods was low kappa (K = 0.016) and was not significant because the 95% confidence interval (0.0625 to 0.0938) includes 0; this does not support any agreement between the two methods. The Bowker’s test of Symmetry of Disagreement (X 2= 68.08, df = 6, P < 0.001) indicates that the disagreement is asymmetrical (null hypothesis of symmetry is rejected), meaning the observations contributing to asymmetry are represented by heavier counts in the upper right hand side corner of the diagonal in the error matrix. Specifically, there were many more polygons rated as severe and very severe by NDVI, while most of them were not rated as damaged by cicadas in the field ground assessment.
Discussion
This study evaluated a sample of newly planted trees in the District of Columbia after the growing season in the summer of 2021, during the Brood X emergence. Trees were evaluated for evidence and impacts of cicada oviposition behavior. Egg-laying preference was different among tree genera and did not have a relationship with the ground field assessment of cicada intensity. This indicates that females might discriminate against certain tree genera. Acer and Nyssa trees experienced the highest levels of egg-laying activity (Light), while Gymnocladus trees exhibited the fewest incidents of egg laying. Females may exhibit preferences for particular tree genera, but acting on such preferences was possibly limited by short dispersal flights within the surrounding area from which they emerged.
Other studies have reported differences in periodical cicada egg laying according to host tree species and genus (Dybas and Lloyd 1974; Miller and Crowley 1998; Clay et al. 2009b). This study found the greatest egg-laying impacts on Acer and Nyssa, similar to an earlier study by Miller and Crowley (1998) reporting heavy egg-laying damage and flagging in Acer spp. and no egg laying in Gymnocladus. Though other studies have reported egg-laying preferences for Quercus spp. as hosts (Dybas and Lloyd 1974; Perkovich and Ward 2022). Observed differences in egg-laying intensity by genus could be explained by overlap in distribution between periodical cicadas and host trees or by chemical or morphological host tree defenses. Acer (based on the most widespread Acer spp., A. rubrum)(Peters et al. 2020) and Nyssa (Coladonato 1992) have quite broad distributions in central, eastern, and southern states that overlap with Brood X (Kritsky 2021). Gymnocladus is represented by just one species (G.dioicus) in North America and is a relatively uncommon species in its native range (Beckman et al. 2021). With the limited exposure of Brood X periodical cicadas to Gymnocladus due to its rarity and limited range, this genus may be unfamiliar to Brood X periodical cicadas as a potential host tree. In addition, it has relatively few pests or pathogen threats (Beckman et al. 2021).
Host tree defenses may limit egg laying, for example conifer species with resin are associated with less egg-laying activity (Miller and Crowley 1998; Clay et al. 2009b). This study did include one conifer genus (Taxodium) comprised mostly of T. distichum. However, Taxodium spp. was subject to intermediate egg-laying activity by cicadas. Gymnocladus with its stout stems (Row and Geyer 2007) and peeling bark may present a challenge to egg-laying cicadas, as suggested by Miller and Crowley (1998). In a study of egg-laying impacts on trees, Miller and Crowley (1998) note that the stem diameter of Gymnocladus typically were larger (closer to 10 mm) than the mean maximum diameter of twigs exhibiting egg-laying scars at 9.12 mm.
Newly planted trees in the District of Columbia experienced minimal effects from periodical cicada egg-laying behavior, as demonstrated by tree condition and the location of egg laying within the trees. Though egg-laying damage was relatively low in most trees, egg laying was related to percent foliage lost. Most importantly, the condition of newly planted trees was not affected by periodical cicada egg-laying damage. Egg-laying damage was minimal enough that trees with the highest amount of damage were still considered in good or excellent condition, as assessed by District Urban Foresters. In addition, the location of damage within trees varied, with egg-laying scars more frequently observed in scaffold and lateral branches compared to the lead stem. Consequently, the risk of damage from cicada egg laying on street tree canopy structure was somewhat minimized as it occurred infrequently in lead stems. Egg laying and related damage in the lead stems has the potential for long-term adverse impacts similar to those observed in topping, resulting in poor branch structure, internal decay, and greater maintenance needs (Gilman and Lilly 2002). Given the minimal impacts of periodical cicada egg laying on tree condition and form, current and prohibitory recommendations for postponing tree planting during periodical cicada emergence years in urban environments, such as Washington, DC, should be revised and reconsidered.
Studies have also found that large scale cicada emergences can actually aid in plant growth in the long term due to an increase in available nutrients as the cicada bodies decay (Yang and Karban 2019). These increases in growth are noticeable 1 to 5 years after a large cicada emergence (Speer et al. 2010; Yang and Karban 2019). Therefore, perhaps newly planted trees during a cicada emergence may receive an extra push towards successful establishment due to this increased release of nutrients.
In the months leading up to the Brood X emergence of 2021, concern for the fate of trees in the Eastern United States came to the forefront in popular and social media (University of Michigan 2021). There was cause for concern given that in the Mid-Atlantic states surrounding the District of Columbia (DE, MD, VA, WV), the private nursery and tree nursery industry accounted for a direct economic footprint of $103 million in direct sales and services in 2017 (Thompson et al. 2021). In addition to direct economic benefits of the tree nursery industry, tree planting is increasingly relied upon for climate adaptation benefits (Eisenman et al. 2021; Pataki et al. 2021). In 2022, the USDA Forest Service announced $1.5 billion in funding for urban and community forestry grants, the majority of which will focus on tree planting and maintenance, while also addressing climate adaptation and extreme heat (USDA Forest Service 2023). Considering the pressing need and value of tree planting in urban areas, it may not be possible for growers and municipalities to avoid planting during large-scale periodical cicada outbreaks.
A large-scale periodical cicada emergence presents an interesting challenge to urban forests and practitioners in the midst of a tree planting campaign. Periodical cicada egg-laying behavior is considered a risk for young trees, but less so for mature trees (Raupp 2021). Periodical cicadas (M. septendecim and M. cassini) preferentially oviposit in small stems of approximately 5 to 10 mm diameter (Miller and Crowley 1998). The impact of such behavior on mature trees is less of a concern compared to younger trees (Raupp 2021), presumably due to the greater overall proportion of small stems on younger trees compared to mature trees. This study, and others (Miller and Crowley 1998; Clay et al. 2009b), demonstrates that periodical cicadas do exhibit host-tree preferences in egg laying. However, the genera and species impacted by egg laying is still quite broad (Clay et al. 2009b), and not all species within a genus are preferred. For example, studies have reported high and low susceptibility to cicada egg laying for Quercus alba and Q. palustris, respectively (Clay et al. 2009b). While other studies report the highest oviposition rates in all host tree species surveyed for Quercus, such as Q. alba, Q. palustris, and Q. rubra (Perkovich and Ward 2022). These impacts differ from specialist urban forest pests, such as emerald ash borer, which has the potential to kill approximately 1.3 million street trees (Fraxinus spp.) between 2020 to 2050 (Hudgins et al. 2022) and can essentially double municipal budgets during peak years of infestation and management (Hauer and Peterson 2017). In comparison, a large-scale periodical cicada emergence is unlikely to have similar long-lasting impacts on urban forest health. This study did not find any evidence of mortality related to cicada egg laying. Overall condition of the tree cohort planted in 2020 to 2021 was similar to previous years in the absence of a periodical cicada emergence. In addition, egg laying occurred less frequently in lead stems compared to scaffold branches. Intact lead stems are important for maintaining a strong central leader in young trees, which helps avoid structural defects later in life such as codominant stems (Luley 2019).
Although Moderate Resolution Imaging Spectroradiomete (MODIS) data has been around since 2000 (Spruce et al. 2011), and ForWarn II is readily available through its website and is easy to use (Norman et al. 2013), the ForWarn II system didn’t provide high enough resolution for this region and pest of interest. The scale of the mapper, which utilizes 232-meter (5.4 hectare) MODIS appeared to be too large to notice the signature of unique foliage damage (flagging) caused by cicadas. This application has been used successfully for numerous change detection forest surveys (Olsson et al. 2016) at the site, county, state, and national level (Norman and Christie 2022) and on numerous forest pests (Eklundh et al. 2009; Spruce et al. 2011; Norman et al. 2013).
The HiForm change detection on the other hand provided detailed maps of NDVI change throughout the cicada outbreak. Although agreement was not as good as in other studies (e.g., Eklundh et al. 2009), the high-resolution change detection did offer a District-wide view of change and gave the best assessment of the potential distribution of cicada activity across the district. That said, ground confirmation would be required to create a higher confidence map of cicada damage. The greater damage intensity found by the remotely sensed product was likely due to a number of issues, such as not selecting the best threshold range for this unique signature, seasonal tree developmental differences (Lukasová et al. 2014), or unique rainfall and temperature patterns (Revadekar et al. 2012) occurring concurrently and impacting the NDVI products. Another issue could be that the high-resolution change detection product was picking up other pest damage (e.g., insect or disease) in addition to the cicada damage. Another factor working against the change detection system was the ephemeral nature of the signature of the cicada and its damage (flagging) do not tend to stay on the tree (Raupp 2021). The damaged branch tips tend to break, die, and are shed by the tree during and not long after the outbreak (Gerhard 1923; Miller 1997). Another issue impacting our remote sensing results could have been perspective; trees appear to have more flagging when viewed from above than from the side. This phenomenon could have caused the overhead perspective to appear more prominently than what appeared from the side of the tree (Figure 7).
In the end, this method (change detection analysis of high-resolution imagery) may not be universally available as it required access to satellite imagery and remote sensing expertise. Aerial imagery of sufficient quality (resolution and lack of clouds) for use in photo interpretation in a scan and sketch project was difficult to obtain, time consuming to look for, and had a time delay associated with its acquisition. Urban areas are known to influence cloud cover during the spring and summer seasons, making working with this type of data more difficult when insects like the cicada are active (Romanov 1999). When a cloud-free image is obtained, it is generally easy to download and incorporate, although images tend to have large file sizes and take long periods to download. These downloads also require a large amount of disk space to store and utilize. In addition, the scan and sketch process is subjective and time consuming but does allow the user an alternative to traditional aerial surveys (Hanavan et al. 2022), whereas forest damage aerial surveys have mostly consisted of forest health specialists observing forest canopies from small, fixed-wing aircraft flown at low elevations (McConnell 2000). Unfortunately, most remotely sensed images available ended up not producing useful information for this study due to cloud cover and had to be omitted as only one viable image was considered usable in the processing.
It was the hope that remote sensing could be a strong tool for creating an accurate map of the cicada damage that was being seen across the District. Remote sensing was not able to do this alone, however ground truthing the remotely sensed map layer was required, as false positives would be included at an unknown rate if all the damage layer positive pixels were assumed to be cicada damage. This did not make the results a failure as the high-resolution damage map layer still provided an operational guide to direct field surveys. With the broad media coverage of the Brood X emergence in 2021, citizen science and social media posts were explored as an additional source of observations of Brood X activity in the district and the surrounding metro area (Kritsky 2021). However, at the time that this research occurred, there were not enough resources to fully pursue community science as a viable resource. It could be a valuable avenue in the future to see cicada impacts on urban trees, especially with newly developed apps like Cicada Safari that are gaining popularity during these large emergence events and collecting data on brood densities and locations.
Conclusions
In this study, periodical cicada activity of one of the largest broods, Brood X, and their potential impacts on young trees in urban environments, such as Washington, DC, was investigated. A sample of street trees in the District of Columbia revealed few impacts of cicada egg laying, where defoliation (the percent foliage lost) was minimal for most trees surveyed and tree condition was not adversely affected. In general, cicadas exhibited a preference for particular genera and scaffold or lateral branches. Together, these results indicate little risk of planting trees in urban areas prior to a periodical cicada emergence. With some tree genera faring better than others, this may allow for tree planting recommendations for particular genera in the planting season preceding a large periodical cicada outbreak. The need for planting trees in urban areas is only growing as city residents depend on them to mitigate the impacts of extreme heat and reduce stormwater runoff, among many other benefits trees provide as nature-based solutions. Fortunately, this study indicates that, at least in the short term, there appears to be little risk to planting new trees in the same year as a large-scale periodical cicada emergence. Follow-up studies of these trees would be beneficial in understanding the long-term impact of egg laying on branch form and canopy structure. As for the use of remote sensing products, it is clear to the authors that although these products and methods are somewhat readily available, the unique damage signature of cicadas may not have been a good match for either of the NDVI products or for the urban environment. Although high-resolution imagery (1.28 feet [0.30 m] or greater) could be used, the difficulty in obtaining high resolution, cloud-free imagery and the need for specialized skills out-weigh what could be accomplished by a timely on-the-ground monitoring system and simple roadside driving surveys.
Conflicts of Interest
The authors reported no conflicts of interest.
Acknowledgements
This research was supported in part by the USDA Forest Service, Forest Health Protection Core Funding to the District of Columbia, District Department of Transportation (21-DG-11094200-163). The District of Columbia Forest Health Coordinator Kasey Yturralde’s salary was partially funded by USDA Forest Service Forest Health Protection Core Funding in federal fiscal years 2021 and 2022. The authors would like to thank the following individuals for their contributions as related to data access: Rowan Moody with Red Bird Consulting (aerial imagery), Chris Hayes with the USDA Forest Service Forest Health Protection (ForWarn Imagery), data analyst Steve Norman and US Forest Service Region 8 Research Team (HiForm), and John Stanovich, retired from the US Forest Service (error matrix statistics). Thank you to Ida Holaskova with West Virginia University, Davis College for her invaluable assistance with statistical analysis. Thank you to the District Department of Transportation Urban Forestry Division staff for their support in the planning and implementation of the annual tree survival study, particularly Earl Eutsler and Simoun Banua.