Street Tree Management Challenges in Small Cities, Iowa, USA
Background
Small and large cities typically both have street trees, but small cities have fewer resources to manage them. Three 1980s papers assessed that small rural cities in the state of Iowa, USA, were at a disadvantage in managing street trees as reflected in the diversity, age, and condition of their street tree populations. This paper analyzes more current street tree inventory data in conducting a similar assessment.
Methods
Street tree inventory data were obtained from small, midsize, and large Iowa cities for 2008 to 2024. Tree diversity, age, and condition were analyzed based on city size. Diversity was assessed by relative abundance percentages and diversity index statistics, age by trunk DBH distributions, and condition by ratings for tree wood and leaves.
Results
Small cities have less street tree diversity than midsize and large cities. A diversity t-test found statistically significant differences based on city size. Small and midsize cities were found to have older tree population profiles than large cities. Large and midsize cities had better condition wood ratings than small cities, but little difference was found between cities for leaf condition.
Conclusions
Inventory data suggest that Iowa’s small cities still face challenges managing their street trees. Lack of funding is the reason most often cited. Progress is being made although its extent cannot be determined due to lack of longitudinal data. There remains a need to assist Iowa’s small cities in sustainably managing their street trees and maintaining the benefits they provide.
Introduction
The devastation wrought by Dutch elm disease (DED)(Ophiostoma ulmi, O. novo-ulmi), which was introduced into the United States in the late 1920s (Copeland et al. 2023) and killed millions of Ulmus americana (American elm) planted as street trees (Campanella 2011), was a calamitous event in the history of urban forestry in North America. It prompted Jorgensen (1970) to coin “urban forestry” as a term, which he defined as the management of urban trees on an areawide, systematic basis rather than on the basis of the individual tree. Managing trees on an areawide, systematic basis required a municipality to have an urban forestry management program (Grey and Deneke 1986). Components of such a program were envisioned ideally to include a street tree inventory and management plan (Tate 1985), a municipal arborist and trained workforce to plant and care for trees (Beatty and Heckman 1981), and a street tree ordinance (Hudson 1985). These components required organization, personnel, and funding by a municipality over a number of years (Clark et al. 1997). However, Kielbaso et al. (1982) found in updating a national survey conducted by Ottman and Kielbaso (1976) of municipal tree programs in the United States that less than 50% of responding municipalities had a systematic tree management program that addressed current and long range needs and that communities with smaller populations were less likely to have such a program than more populous ones. Similarly, on the level of the individual states, Reynolds et al. (1981) found that smaller cities in Minnesota, USA, often did not have a sufficient governmental structure to operate a shade tree program, and Tate (1984) reported that New Jersey, USA, cities with populations less than 5,000 expended far less money per tree on management than the state’s more populous cities.
Subsequent research has confirmed that municipalities with larger populations are more likely to have the resources to establish or sustain an effective tree management program than municipalities with smaller populations (Schroeder et al. 2003; Ries et al. 2007; Grado et al. 2013; Hauer and Peterson 2016; Hargrave et al. 2024). Consequently, Karlovich et al. (2000) found that street trees in 4 small, rural Illinois, USA, communities were characterized by low species diversity and tree topping; Galvin and Bleil (2004) found that in many smaller communities in Maryland, USA, there was no staff person or department legally responsible for the care and management of the community’s trees; Neupane et al. (2022) found that in the Southeastern United States the presence of municipal vegetation ordinances depended upon community population size, and communities with smaller populations were more likely not to have such ordinances; and Groninger et al. (2002) questioned if the challenges faced by small, rural communities practicing urban forestry in the United States were so great that these communities could even practice urban forestry.
In the state of Iowa, United States, 3 papers written between 1981 and 1985 identified and discussed street tree management issues and concerns in the state’s smaller, more rural communities amidst the devastation wrought by DED (Wray and Jungst 1981; Wray and Prestemon 1983; Wray and Mize 1985). These papers made use of data collated from street tree inventories conducted in 1978 as part of a research project by the Department of Forestry at Iowa State University in conjunction with the Iowa Conservation Commission’s Forestry Section, a precursor of the state’s Department of Natural Resources. Inventories were conducted in 40 randomly selected, geographically dispersed municipalities with populations between 500 and 10,000. Communities of this size, deemed to be “smaller communities,” were targeted because municipalities with populations greater than 10,000, deemed to be “larger communities,” were considered more likely to have programs and departments managing their street trees due to greater resources (Wray and Prestemon 1983). In fact, these papers found that none of the selected smaller communities had an urban forestry program with continuous, regularly scheduled activities; maintenance was sporadic and often performed only in cases of severe need; street tree planting was a low priority item because of limited financial resources; and management plans were nonexistent (Wray and Jungst 1981). Analysis of the inventory data focused on 3 aspects of street tree populations: tree diversity, tree age as measured by trunk diameter at breast height (DBH), and tree condition. Results of this analysis were then used to make judgments on the efficacy of street tree management practices in the selected smaller communities.
This paper takes another look at street trees in Iowa’s smaller communities. It revisits many of the issues discussed in the papers written by Wray and Jungst (1981), Wray and Prestemon (1983), and Wray and Mize (1985). It does so by analyzing more recent street tree inventory data from small, midsize, and large Iowa municipalities. These data include a large dataset compiled by the Iowa Department of Natural Resources from small and midsize communities and inventories conducted by commercial vendors mostly from larger communities. Findings are made from these more recent data for street tree composition and structure on the basis of community size. Emphasis is given to the diversity of street tree species and genera as a crucial factor in the sustainable management of street trees given the legacy of DED, but tree age and condition are also considered. Finally, findings made from these more recent data provide a starting point to discuss some of the issues faced today by smaller Iowa communities in managing their street trees in order to maintain the environmental, social, and economic benefits these trees provide (Mullaney et al. 2015). Comparisons are made where valid with the findings contained in the papers written by Wray and Jungst (1981), Wray and Prestemon (1983), and Wray and Mize (1985).
Methods
Study Area
Iowa is the 23rd largest of the 50 states comprising the United States, with a land area of 144,659 km2 (55,853 mi2) and a population of 3.24 million (US Census 2024). The state is divided into 99 counties which in turn contain 948 cities and 86 Census Designated Places (CDPs)(Iowa State Data Center 2025). A CDP is a densely settled population center that has a name and community identity and is not part of any incorporated place (US Census 1994). The state also contains townships which are administrative subdivisions of counties that provide limited functions such as fire protection, cemetery management, fence maintenance, and boundary dispute resolution in rural areas outside the scope of counties and cities (Story County Iowa 2025). Somewhat confusingly, Iowa’s small rural incorporated communities are often referred to as towns. For example, the 3 papers written by Wray and Jungst (1981), Wray and Prestemon (1983), and Wray and Mize (1985) referred to the 40 municipalities where street tree inventories were conducted as towns, when, based on state code, they are more accurately cities (Iowa General Assembly 2025). For the purposes of this study and to avoid confusion, the state’s small rural incorporated communities will be referred to as cities.
Iowa’s climate is humid continental (Köppen Dfa and Dfb) with year-round precipitation (Bailey 2016). The majority of the state is located in the Southern Shortgrass Prairie biome (Great Plains), and the remainder of the state is located in the Central Appalachian Forest biome (Eastern Temperate Forest) (Bailey 2016). USDA Plant Hardiness Zones 4b, 5a, 5b, and 6a are contained within the state (Figure 1). Zone boundaries between the 2012 and 2023 hardiness zone maps have shifted from south to north as average annual minimum winter temperatures have increased (PRISM Group 2012, 2023). Zone 4b, the coldest zone, has decreased in area from 134,886 km2 (52,080 mi2) to 37,925 km2 (14,643 mi2), and Zone 6b, the warmest zone, has increased in area from 425 km2 (164 mi2) to 42,945 km2 (16,581 mi2).
Figure 1.
Iowa, USA, 2012 and 2023 USDA plant hardiness zone maps.
The grasslands associated with the prairie ecosystem, when tilled under, produced some of the most fertile soils for agriculture in the United States (Mutel 2008), and agriculture became Iowa’s most important industry after statehood in 1846 (Schwieder 1996). In 1900, 97% of Iowa land was occupied by farms, and the rural population totaled 2.23 million, which was 74.4% of the state’s population (US Census 1900). However, as farms became more mechanized and the state’s industrial sector grew, the rural population decreased (Mutel 2008), and in 2020 the rural population totaled 1.18 million (36.8% of the state’s population) and the urban population totaled 2.01 million (63.2% of the state’s population)(Burke 2021). Additionally, the rural population is aging due to the out-migration of youth under 25 years of age and experienced workers aged 45 to 64 to the state’s large metropolitan areas, as well as due to a decline in the number of births as compared to the number of deaths (Peters 2024). Despite these trends, Iowa’s small rural communities are not dying. The decrease and aging of the rural population has been moderated by an influx of persons of color (Peters 2024), and polling indicates that living in small rural communities still has considerable appeal (Parker et al. 2021). Moreover, Iowa’s small rural communities remain a significant part of its cultural and economic heritage (Bremer 2023), and state government and other entities have made efforts to better understand and address the challenges facing these communities, including street tree management, in order to revitalize them.
Datasets
As stated above, the Wray and Jungst (1981), Wray and Prestemon (1983), and Wray and Mize (1985) papers focused on the challenges faced by small, rural Iowa cities in managing their street trees by analyzing data from street tree inventories conducted in 1978 in 40 randomly selected Iowa cities having a population between 500 and 10,000 in the 1970 United States Census. In 1970 there were 413 cities in Iowa with a population between 500 and 10,000 (Iowa State Data Center 2025). Therefore, the 40 cities selected comprised a 9.7% percent sample of all Iowa cities in that population range. Cities were assigned to one of four groups based on population size. There were 13 cities (32.5%) with a population between 500 and 999; 13 (32.5%) with a population between 1,000 and 2,449; 8 (20.0%) with a population between 2,500 and 4,999; and 6 (15.0%) with a population between 5,000 and 9,999. For each of the 40 cities, a complete inventory was conducted that included trees along streets on public property and in publicly owned parking areas (Wray and Mize 1985). Park trees were not inventoried. Data were collected for more than 39,000 trees. The raw data from these inventories are unavailable. However, the 3 papers provide summary statistics for tree species relative abundance (minimum 100 trees per species), trunk diameter size (5 classes in inches), and tree condition (good, fair, and poor). Tree condition was reported according to these criteria: good trees were those requiring no care or maintenance or only minimal maintenance such as minor pruning; fair trees were those in need of corrective treatments if they were to function for more than 10 additional years; and poor trees were those that probably would not survive longer than 2 years without corrective action (Wray and Mize 1985). The inventories providing the data for the papers written by Wray and Jungst (1981), Wray and Prestemon (1983), and Wray and Mize (1985) are hereafter referred to as the 1978 dataset.
More recently, beginning in 2009, Iowa’s Department of Natural Resources (IDNR) initiated a program to conduct street tree inventories and create urban forestry management plans for small cities in the state; small cities were defined as those with a population of 5,000 or less (Iowa DNR 2024a). This definition is consistent with the United States Census Bureau’s definition of a small town or city (Toukabri and Medina 2020) but does not correspond with the definition of ‘small’ by Wray and Jungst (1981), Wray and Prestemon (1983), and Wray and Mize (1985). The IDNR also defined a midsize city as having a population of 5,001 to 49,999 and a large city as having a population of 50,000 or more. Based on the IDNR definitions, the 1970 United States Census found that there were 931 small cities, 56 midsize cities, and 7 large cities in Iowa, whereas the 2020 Census found 857 small cities, 74 midsize cities, and 11 large cities (Iowa State Data Center 2025). For the purposes of this paper, Iowa cities are classified according to size by their 2020 Census population. As of 2024, IDNR had conducted tree inventories in 448 small cities (52.3% of small cities statewide), 47 midsize cities (63.5% of midsize cities statewide), and 1 large city (9.1% of large cities statewide). Of those inventoried by IDNR, 128 cities (25.8%) had a population of 500 or less.
ArcGIS Collector was used by IDNR personnel to collect tree inventory data in walking surveys; data were then run through either i-Tree Streets or Eco (Nowak 2024), depending on the year in which the inventory was conducted, to calculate street tree benefits (Hannigan 2025, personal communication). Data were collected for more than 330,000 trees, including both street trees and park trees. Data attributes for each tree included trunk diameter size (9 DBH classes in inches), land use type, location type, and longitude and latitude coordinates. Each tree received one of four conditions ratings—good, fair, poor, and dead or dying—for wood and for leaves according to i-Tree protocols, which are also commonly used by private data collection software. Species and genus were identified for most but not all trees. For example, 10,518 trees (3.17%) were classified as Broadleaf Deciduous, Broadleaf Evergreen, or Conifer Evergreen, and 292 trees (0.09%) were classified as Unknown. In addition, 58,637 trees (17.65%) were classified at the genus level but not at the species level. For example, 773 trees were classified as birch (Betula spp.), 297 trees were classified as dogwood (Cornus spp.), and 1,863 trees were classified as oak (Quercus spp.), etc. The management plans based on the inventories included recommendations to improve tree diversity, to plant additional trees and reduce the maturity of the overall tree age profile, and to address maintenance issues associated with tree health. The plans also included a 6 year tree maintenance plan based on existing municipal funding and a summary of annual tree benefits calculated with i-Tree software.
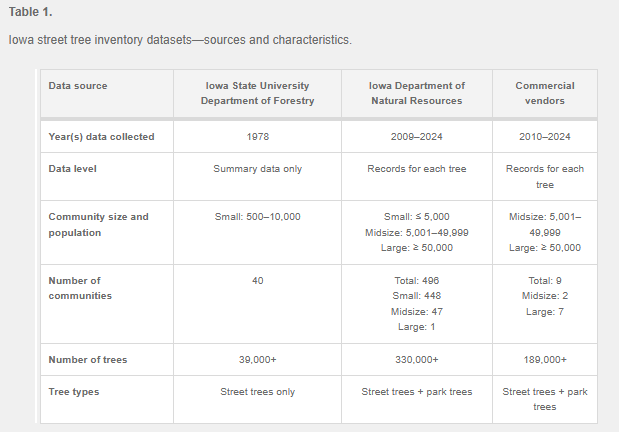
Besides the data contained in the IDNR street tree inventories, data were obtained for this paper from 2 midsize cities and 7 large cities that conducted inventories between 2008 and 2024 independently of IDNR. These cities employed different commercial vendors to conduct the inventories. Data were collected for more than 198,000 trees including both street trees and park trees. Data attributes collected for each tree included species and genus, trunk diameter size (DBH in inches), location information, and longitude and latitude coordinates. Some, but not all, inventories contained ratings on tree condition which approximate the ratings made in the IDNR inventories. The data associated with the IDNR inventories and the data associated with the inventories conducted between 2008 and 2024 independently of IDNR are hereafter referred to collectively as the 2008 to 2024 datasets. Table 1 contains the sources and characteristics of the datasets discussed in this paper.
Ideally, all the data obtained for this study would have been collected utilizing the same methods and metrics so that the data are fully comparable. This was not the case, which is not surprising given the typical lack of standardization in tree inventory data collection (Roman et al. 2013). As a result, analyses of these data and the validity of any findings are conditioned by the differences in the datasets. Additionally, since only summary data from the 1978 dataset are available, the ability to make longitudinal comparisons with the 2008 to 2024 datasets is limited, and caution is exercised in making them.
Street Trees and Park Trees
The 1978 dataset contained data for trees located along streets and in publicly owned parking but not in parks (Wray and Mize 1985). The 2008 to 2024 datasets contain data for both street trees and park trees; park trees account for 33% of all trees inventoried by IDNR and for 37% of all trees inventoried independently of IDNR. Data attributes for the 2008 to 2024 datasets allow street trees to be differentiated from park trees. This is important because studies have found that growing conditions and population structures associated with street trees and park trees are significantly different, and they should be evaluated separately (Welch 1994; Nielsen et al. 2007; North et al. 2018). Accordingly, to support the validity of findings made from the 2008 to 2024 datasets and comparisons made between those datasets and the 1978 dataset, parks trees were differentiated from street trees in the 2008 to 2024 datasets and are not included in those analyses.
Tree Diversity
Wray and Prestemon (1983) believed that “diversity in street tree populations is a desirable goal because it reduces potential problems with insects, diseases, and species adaptability.” Based on the finding that the 3 most abundant species in the 1978 dataset varied from 30.2% to 64.6% by city, they judged the “mix and distribution of [tree] species” to be inadequate and “the largest potential management problem that the smaller communities face.” This appraisal was in large part a reaction to the overplanting of elms as street trees in Iowa and the subsequent impact of DED. For example, in Des Moines, Iowa’s largest city and the state capital, DED killed approximately 175,000 elms on public and private property between 1960 and 1970, and the cost to remove and dispose of dead elms was nearly 20 million USD (Wray and Jungst 1981). The concern with tree diversity was prescient because, despite the lessons ostensibly learned from overplanting elms, ash trees were planted in large numbers in many Iowa communities to replace the elms killed by DED (Thompson et al. 2021) and since 2010 have become fodder for the emerald ash borer (EAB)(Agrilus planipennis)(Iowa DNR 2016).
A commonly used metric to assess the diversity of a community’s tree population is a relative abundance distribution which quantifies the percentage of each tree species and genus relative to the population as a whole. Santamour (1990) made use of relative abundance in proposing the 10-20-30 rule whereby no tree species should comprise more than 10%, no tree genus should comprise more than 20%, and no tree family should comprise more than 30% of a municipally managed tree population. He believed these limits on abundance would render a tree population less vulnerable to a pest or disease and avoid repeating what had happened with DED. Santamour’s 10-20-30 rule has since become widely accepted in municipal tree management to benchmark diversity and is applied most often to tree species and genera. However, because some pests and diseases affect more than a single tree species or genus, it has been argued by some that the 10-20-30 rule does not go far enough in benchmarking diversity and that a 5-10-15 rule should be used instead (Bassuk et al. 2009; Watson 2017). Additionally, climate change, which is generally associated with more extreme weather such as prolonged periods of drought and more intense rainfall events (Brandt et al. 2021), and which has also increased the range of pests and diseases threatening urban trees (Tubby and Webber 2010), has further emphasized the importance of diversity in tree population stability (Morgenroth et al. 2016).
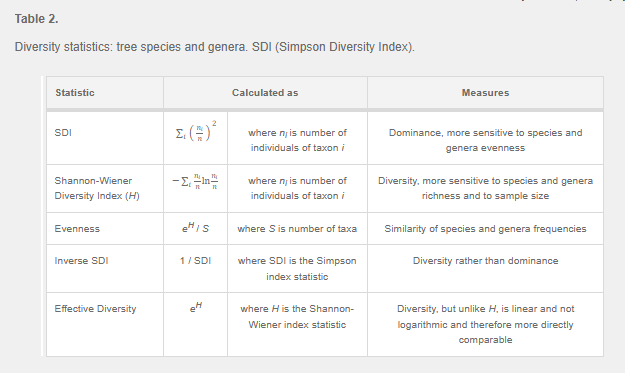
In addition to relative abundance, other metrics commonly used to assess the diversity of street tree species and genera include the following diversity statistics (Table 2): the Buzas and Gibson evenness index (Buzas and Gibson 1969), which appraises the degree to which all species and genera abundances are divided equitably within the species and genus distributions; the Simpson Diversity Index (SDI) (Simpson 1949), which evaluates the dominance of species and genera within those distributions and is sensitive to species and genera evenness; and the Shannon-Wiener Diversity Index (Shannon 1948), which is more sensitive to species and genera richness than to evenness in gauging diversity. Additionally, the Inverse of the Simpson Diversity Index (Inv SDI or 1/SDI) is sometimes preferred to the SDI because its values increase inversely to dominance and therefore equate more clearly with diversity (Sun 1992; Sreetheran et al. 2011), and effective diversity (eH where H is the Shannon-Wiener Diversity Index value) is sometimes preferred to Shannon-Wiener because, unlike Shannon-Wiener, its scale is linear and not logarithmic, and the statistic is therefore more directly comparable (Jost 2006).
The 3 papers based on the 1978 dataset summarized the relative abundance percentages of the 10 most common street tree species found in the 40 inventoried cities. For this paper, street tree species and genera for each city contained in the 2008 to 2024 datasets were grouped according to the city’s population and the IDNR definitions of small, mid-size, and large size cities. The relative abundance percentages were then calculated for those species and genera associated with each city size class. The percentages of the 5 most prevalent species and genera in each city class were identified and summed. In addition to relative abundance, this paper calculated statistics for street tree species and genera at each city size class for the diversity metrics in Table 2. Diversity statistics cannot be calculated for the 1978 dataset because they require tree data for each city and only summary data are available. Also, for the 2008 to 2024 datasets only, a diversity t-test (Hutcheson 1970) was utilized to assess the statistical significance of differences (P < 0.05) for Shannon-Wiener Index values between city size classes. The diversity statistics and t-test were calculated with PAST Paleontological Statistics software version 4.17 (Hammer et al. 2001).
Tree Age
Street tree populations are vulnerable not only to pests and disease, but also to other factors (Steenberg et al. 2019). Prominent among these factors are environmental stressors including but not limited to more extreme temperatures, de-icing salts, and soil compaction, which increase tree mortality (Carol-Aristizabal et al. 2024). Wray and Mize (1985) were cognizant that “street-tree planting environments are among the most severe encountered” and that “not all climatically adapted species are good candidates for use in street or similar environments.” Accordingly, they judged those tree species which had most frequently grown to maturity while also remaining in good condition to be species best suited as street trees in Iowa. As part of this assessment, data were taken for tree species, many of which were among the most common street tree species found in the 40 inventoried cities, based on 5 DBH size classes: 0 cm to 7.62 cm (0 in to 3 in), 7.62 cm to 15.24 cm (3 in to 6 in), 15.24 cm to 30.48 cm (6 in to 12 in), 30.48 cm to 50.80 cm (12 in to 20 in), and > 50.80 cm (> 20 in). Unfortunately, results were reported for each species as a percentage of the DBH class found in good condition without specifying the number of trees contained in each DBH class. Therefore, DBH distributions cannot be generated for prevalent street tree species from the 1978 dataset. However, Wray and Jungst (1981) did report size distribution percentages of all inventoried street trees by the same DBH size classes utilized by Wray and Mize (1985), and a DBH distribution of all trees contained in the 1978 dataset can be generated.
At about the same time that Wray and Jungst (1981) and Wray and Mize (1985) collected trunk diameter data and assessed tree species best suited as street trees in Iowa’s small cities, Richards (1983) reasoned that the stability of a street tree population depended not only on the selection of those tree species “adapted for long-term success” but also on a population with “good age diversity” with larger numbers of young trees relative to the number of mature trees in order to account for the mortality of young trees after planting in the establishment phase. Subsequent research has confirmed that street tree population growth is constrained by high mortality among young trees in the first few years after planting when environmental stressors are particularly acute and that annual mortality is lower for midsize and large trees (Roman et al. 2014; Czaja et al. 2020). This has led to wide acceptance of the construct of a descending tree size distribution based on trunk diameter (DBH) as desirable in street tree management and particularly to tree establishment; however, this construct may not be as applicable to the management of other urban trees, such as park trees and trees on private property, or if maximizing ecosystem services is a priority (Morgenroth et al. 2020).
The IDNR management plans based on the inventories in the 2008 to 2024 datasets agreed with the desirability of a descending DBH distribution to ensure enough young trees were being planted to account for the mortality of older trees as they aged and their health declined (Iowa DNR 2013). Similarly, the management plans associated with the inventories conducted independently of IDNR recommended a descending DBH tree distribution not only to account for tree attrition (City of Des Moines 2020) but also to ensure the continued flow of tree benefits and a more uniform workflow allowing managers to more accurately allocate annual maintenance funds (Iowa City 2018). Accordingly, trunk diameter data were collected in the IDNR inventories. These data were aggregated into 9 DBH size classes: 0 cm to 7.62 cm (0 in to 3 in), 7.62 cm to 15.24 cm (3 in to 6 in), 15.24 cm to 30.48 cm (6 in to 12 in), 30.48 cm to 45.72 cm (12 in to 18 in), 45.72 cm to 60.96 cm (18 in to 24 in), 60.96 cm to 76.20 cm (24 in to 30 in), 76.20 cm to 91.44 cm (30 in to 36 in), 91.44 cm to 106.68 cm (36 in to 42 in), and > 106.68 cm (> 42 in). For tree inventories conducted independently of IDNR, DBH data either were collected in inches and then aggregated into the 9 DBH classes listed above or were assigned during collection into the same 9 DBH classes. Data in the 0 cm to 7.62 cm (0 in to 3 in) DBH size class can be instructive in understanding the number and species of those trees most recently planted. However, it also creates in tandem with the 7.62 cm to 15.24 cm (3 in to 6 in) DBH size class unequal frequency intervals and complicates the analysis of DBH distributions. Therefore, for all DBH data contained in the 2008 to 2024 datasets, data in the 0 cm to 7.62 cm (0 in to 3 in) and 7.62 cm to 15.24 cm (3 in to 6 in) size classes were aggregated to create a 0 cm to 15.24 cm (0 in to 6 in) size class, resulting in 8 DBH size classes instead of 9. DBH distributions were then calculated for each city size class and for the most prevalent tree species and genera found in those size classes.
Tree Condition
There are many reasons for rating tree condition in a street tree inventory. These include an assessment of tree health, the risk of tree failure, the presence of tree pests and disease, understanding and budgeting for maintenance needs, and calculating compensatory tree replacement cost (Ma et al. 2021). As stated above, Wray and Mize (1985) rated mature tree condition in terms of survivability and the need for corrective maintenance. For example, many trees required minimal pruning and were therefore classified as being in good condition since minimal pruning was not considered a threat to tree longevity. Ratings were intended not only to inform prospective maintenance costs but also to suggest those tree species best suited as street trees in Iowa. Species where 90% or more of trees received good ratings were judged to be acceptable candidates for street trees, and species exhibiting the biggest declines in good ratings as trunk diameter increased were judged to be poor choices.
More recently, importance has been given to tree condition because trees in good health provide more ecosystem services than trees in poor health (Hintural et al. 2024). Both i-Tree Streets and Eco incorporate tree condition ratings when estimating ecosystem services and other benefits provided by urban trees. Inventories conducted by IDNR made separate ratings for wood condition and leaf condition in accordance with i-Tree protocols. Each tree received one of four ratings—good, fair, poor, and dead or dying—for wood and for leaves. For i-Tree Streets, these ratings reflect replacement factor percentage values utilized by the Council of Tree & Landscape Appraisers (USDA Forest Service 2010). For i-Tree Eco, these ratings reflect percentages of crown health and dieback (USDA Forest Service 2018). Some, but not all, of the inventories conducted independently of IDNR utilized the same rating scale to make condition ratings for both wood and leaves. Other inventories used the same scale but combined wood and leaves into a single overall rating for tree condition. Since an overall tree condition rating might not agree with separate ratings for wood and leaf condition, inventories that combined wood and leaves into an overall condition rating were excluded from assessing tree condition on the basis of city size, both for all inventoried trees and for prevalent street tree species.
Results
Tree Diversity
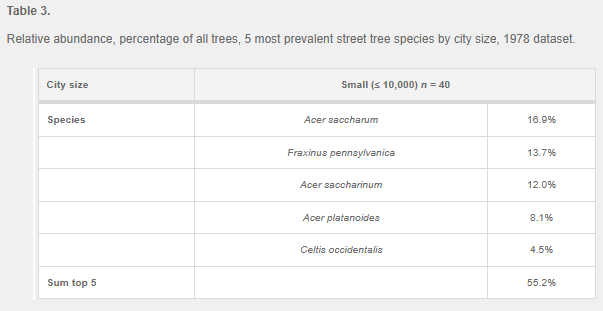
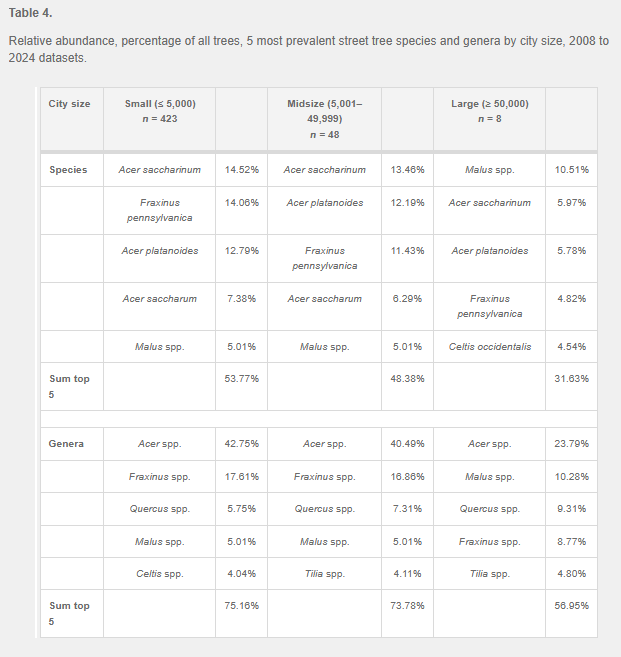
For the 40 small cities comprising the 1978 dataset, Acer saccharum (sugar maple, 16.9%) was found the most common street tree species, followed by Fraxinus pennsylvanica (green ash, 13.7%), A. saccharinum (silver maple, 12.0%), A. platanoides (Norway maple, 8.1%), and Celtis occidentalis (northern hackberry, 4.5%)(Table 3). Relative abundance percentages for street tree genera were not reported, but the 3 Acer (maple) spp. above account for 37.0% of all inventoried street trees. For the 2008 to 2024 datasets, A. saccharinum (14.52%) was found to be the most abundant species in small and midsize cities and Malus spp. (crabapple, 10.51%) the most abundant species in large cities (Table 4). Percentages of A. saccharinum, F. pennsylvanica, and A. platanoides slightly exceeded Santamour’s 10% benchmark for species relative abundance in small and midsize cities, but not in large cities. At the genus level (Table 4), Acer spp. was found to be the most abundant genus in small, midsize, and large cities. The percentage of Acer spp. substantially exceeded Santamour’s 20% benchmark for genus relative abundance in small and midsize cities but only slightly exceeded that benchmark in large cities. Little difference was found between small and midsize cities in the summed percentage of the 5 most prevalent street tree species. However, the summed percentages of the 5 most prevalent street tree species and genera in large cities were found to be substantially less than the summed percentages in small and midsize cities.
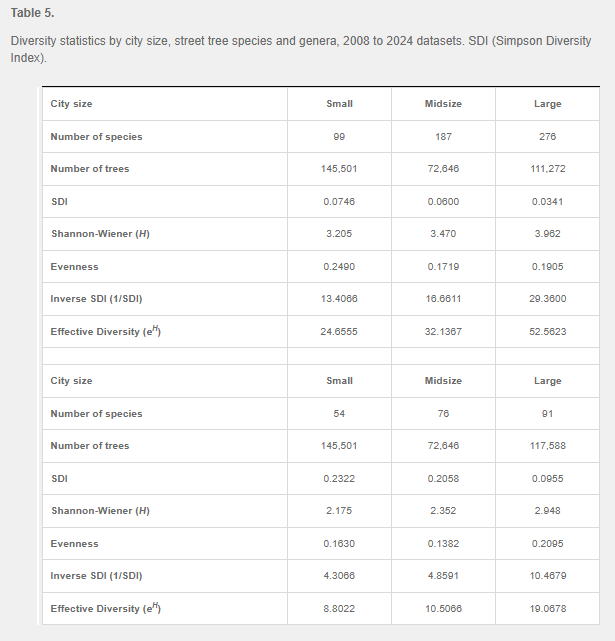
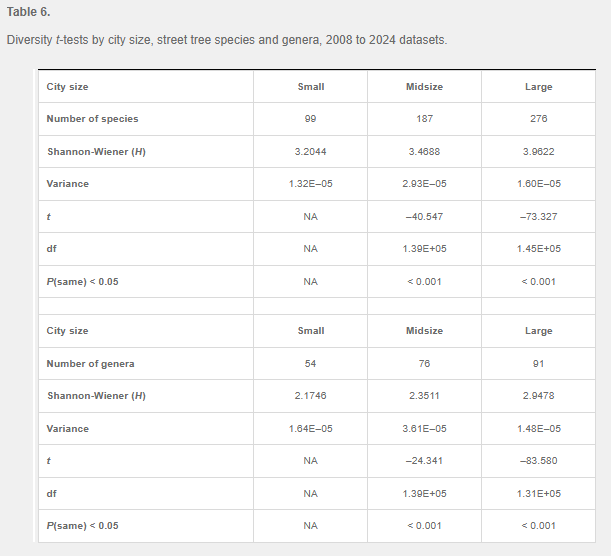
In addition to assessing street tree diversity based on relative abundance percentages, statistics were calculated for the 2008 to 2024 datasets at species and genus levels for SDI, the inverse of the SDI (Inverse SDI), the Shannon-Wiener Diversity Index, distribution evenness, and effective diversity (Table 5). For street tree species and genera, the Inverse SDI and effective diversity increased as city size increased, as did species and genera richness (i.e., the number of species and genera). Increases were larger between midsize and large cities than between small and mid-size cities. Results for distribution evenness were mixed. Evenness for street tree species declined from small to large cities while evenness for street tree genera evenness increased from small to large cities. Lastly, diversity index t-tests (Hutcheson 1970) assessed the statistical significance of differences in the Shannon-Wiener Diversity Index for all street tree species and genera between city sizes. Statistically significant increases (P < 0.05) were found in the Shannon-Wiener Diversity Index for both street tree species and genera between successive city size classes (i.e., diversity increased significantly from small to mid-size cities and from midsize to large cities)(Table 6).
DBH Distributions
For the 40 small cities comprising the 1978 dataset, a DBH distribution was generated for all inventoried street trees. Results showed a strong descending trend line in the 2 smallest size classes and a peak in the 30.48 cm to 50.80 cm (12 in to 20 in) size class (Figure 2). Wray and Prestemon (1983) noted the large proportion of trees (nearly 50%) in the two smallest size classes and believed it represented a surge in new tree planting in the wake of DED. They attributed the smaller numbers of large trees not only to the impact of DED but also to severe urban planting environments which resulted in slower tree growth.
Figure 2.
DBH distribution, all street trees, small cities, 1978 dataset.
For the 2008 to 2024 datasets, DBH distributions were generated by city size for all street trees and for prevalent street tree species and genera. Distributions showed peaks in the 30.48 cm to 45.72 cm (12 in to 18 in) DBH size class for small and midsize cities. These peaks suggest that older aged profiles will result due to an insufficient number of young trees in the 0 cm to 15.24 cm (0 in to 6 in) DBH size class to compensate for tree mortality. By contrast, results for large cities showed a consistent descending trend line from small to large DBH size classes, suggesting a sufficient number of young trees to compensate for tree mortality (Figure 3).
Figure 3.
DBH distributions, all street trees by city size, 2008 to 2024 datasets.
DBH distributions by city size were also generated for the 5 most prevalent street tree species in the 2008 to 2024 datasets. Distributions for A. saccharinum, F. pennsylvanica, A. platanoides, and A. saccharum showed peaks in the DBH classes between 45.72 cm and 76.20 cm (18 in to 30 in) for all city sizes, suggesting older age profiles for those species. The distribution for C. occidentalis showed peaks for small and midsize cities in the 60.96 cm to 76.20 cm (24 in to 30 in) DBH size class; the distribution for large cities was mixed, showing a peak in the 45.72 cm to 60.96 cm (18 in to 24 in) size class, but also a large percentage of trees in the 0 cm to 15.24 cm (0 in to 6 in) size class, suggesting a recent surge of planting this species in large cities. The distribution for Malus spp. showed a descending trend line from small to large DBH size classes suggesting sufficient young trees were planted to compensate for tree mortality. The lack of many Malus spp. trees in size classes greater than 60.96 cm (24 in) reflects the comparatively small stature of this species and its many cultivars. Statistics and graphs for the DBH distributions of prevalent street tree species can be found in the Appendix (Figures S1 to S6).
DBH distributions by city size for the 5 most prevalent street tree genera were more nuanced. Distributions for Acer spp., Fraxinus (ash) spp., Celtis (hackberry) spp., and Tilia (linden) spp. evidenced peaks in the DBH classes between 30.48 cm and 76.20 cm (12 in and 30 in) for all city sizes. At the same time, there were strong descending trend lines for Acer spp., Celtis spp., and Tilia spp. between 0 cm and 30.48 cm (0 in to 12 in) in large cities, suggesting a surge of new plantings in those communities. The surge in Acer spp. was due mostly to big increases in A. rubrum (red maple) and A. tataricum (Tatarian maple) in the 0 cm to 15.24 cm (0 in to 6 in) DBH size class. Conversely, there appeared to be a large decline for Fraxinus spp. in the 0 cm to 15.24 cm (0 in to 6 in) size class, although the drop-off in large cities was not as large as in small and midsize cities. The distribution for Quercus (oak) spp. showed a descending trend line for all city sizes, but the trend was especially strong in large cities. The distribution for Malus (apple) spp. was similar to the Malus (crabapple) spp. distribution, which is not surprising since street trees in that genus are comprised mostly of Malus (crabapple) spp. Statistics and graphs for the DBH distributions of prevalent street tree genera can be found in the Appendix (Figures S7 to S12).
Condition
For the 40 small cities comprising the 1978 dataset, Wray and Prestemon (1983) reported that the percentage of all street trees receiving good condition ratings improved slightly from 87.7% to 91.2% as city population increased. Wray and Mize (1985) reported results for individual street tree species and for trees in each species rated as being in good condition. Among the most prevalent street tree species (Table 3), C. occidentalis had the most trees (96%) and A. saccharinum the fewest trees (87%) rated in good condition; U. americana received the lowest ratings among all street tree species with only 54% of trees rated in good condition. Wray and Mize (1985) also reported results for tree species and the decline in the percentage of trees for each species rated in good condition as trunk diameter increased. They found A. saccharum and F. pensylvanica to be the species with the most deterioration in tree condition as trunk diameter increased and A. platanoides the species with the least.
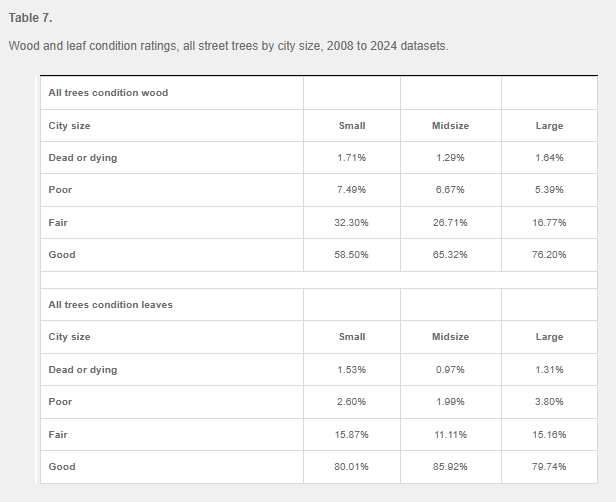
Distributions for tree condition (wood and leaves) were generated from the 2008 to 2024 datasets for all street trees by city size (Table 7). Results for wood condition for all street trees indicated an increase in the percentage of trees with good wood ratings and a decrease in the percentage of trees with fair wood ratings as city size increased. There was a slight decrease in poor wood ratings as city size increased but an increase in dead or dying wood ratings as city size increased from midsize to large. Ratings for leaf condition for all street trees did not reflect a clear trend as city size increased. Results for midsize cities were inconsistent.
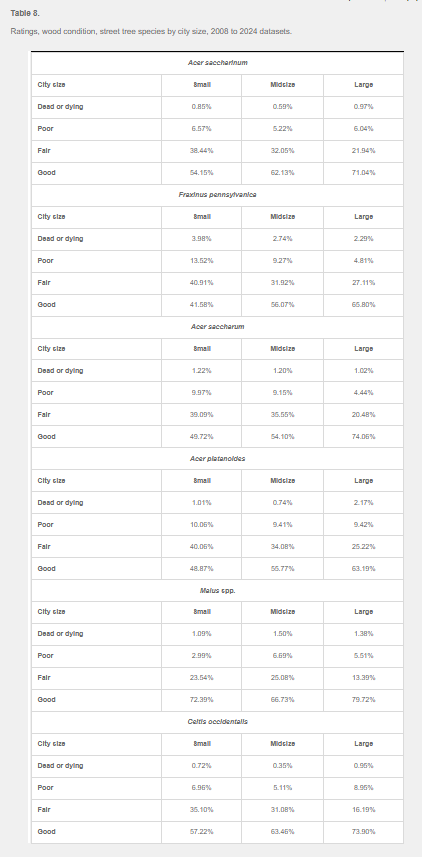
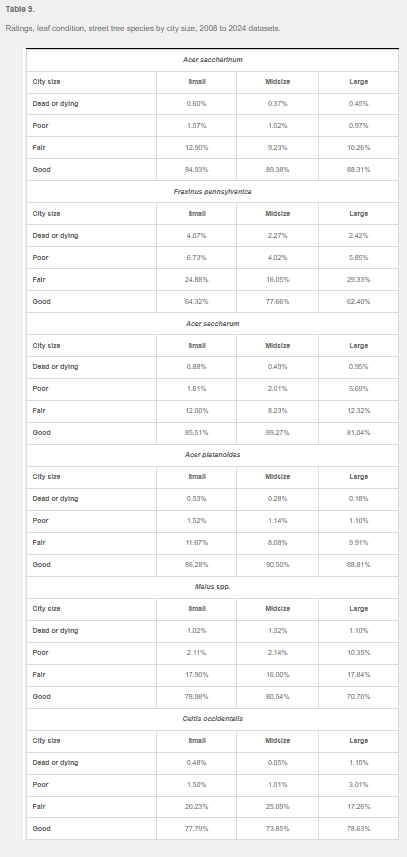
Distributions for wood condition and for leaf condition were also generated from the 2008 to 2024 datasets for prevalent street tree species by city size. Results for wood condition for all prevalent street tree species indicated an increase in the percentage of trees with good wood ratings and a decrease in the percentage of trees with fair wood ratings as city size increased (Table 8). The percentage increase in good wood ratings as city size increased was greatest for A. saccharum and least for Malus spp. Between small and large cities, there was an increase in dead or dying wood ratings for all species except for F. pennsylvanica and A. saccharum and a decrease in poor wood ratings for all species except for Malus spp. and C. occidentalis. Results for leaf condition for prevalent street tree species did not indicate a clear trend as city size either increased or decreased (Table 9). In fact, for all species except C. occidentalis, the largest percentages of trees with good leaf condition ratings were associated with midsize cities.
Finally, distributions for tree condition (wood and leaves) were generated from the 2008 to 2024 datasets for all street trees by DBH classes. Results for wood condition for all cities indicated a decrease in the percentage of trees with good ratings and an increases in the percentages of trees with fair, poor, or dead or dying ratings as DBH size increased (Figure 4). Conversely, results for leaf condition for all cities did not indicate a clear trend as DBH size either increased or decreased (Figure 5).
Figure 4.
Ratings, wood condition, all street trees by DBH class, 2008 to 2024 datasets.
Figure 5.
Ratings, leaf condition, all street trees by DBH class, 2008 to 2024 datasets.
Discussion
Wray and Jungst (1981) believed that small Iowa cities with populations of 500 to 10,000 faced significant challenges in managing their street trees due to a lack of funding, knowledge, and organization. They further believed these challenges were reflected in findings made from a statewide sample of street tree inventory data collected in the 1978 dataset. These findings focused on 3 structural features of street tree populations: diversity, age, and condition. According to Ma et al. (2021), these are the 3 types of data most commonly collected in street tree inventories for the purpose of street tree management. This paper analyzed a more recent statewide sample of street tree inventory data collected in the 2008 to 2024 datasets to also explore the challenges facing small Iowa cities with populations of 5,000 and less in managing their street trees. It made findings for tree diversity, age, and condition not only for small cities but also for midsize and large cities as well.
The 1978 and 2008 to 2024 datasets were collected in the aftermath of recent losses caused to a prevalent street tree species and genus by a fungus or pest: DED for the 1978 dataset and the EAB for the 2008 to 2024 datasets. As a result, tree diversity was a major concern for the 3 papers based on the 1978 dataset and for the IDNR management plans based on the 2008 to 2024 datasets. The 1978 and 2008 to 2024 datasets both indicated that an increase in street tree diversity was warranted, especially for tree genera in small cities due to an overabundance of trees belonging to the Acer genus. The need for increased diversity at the species level did not appear to be as pressing since A. saccharum, the most abundant tree species in the 1978 dataset, accounted for 16.9% of all trees, and A. saccharinum, the most abundant tree species in the 2008 to 2024 datasets for small and midsize cities, accounted for 14.52% of all trees in small cities (Tables 3 and 4). By contrast, Ball et al. (2007) found in a study of 34 communities in South Dakota that, for 21 communities with populations less than 5,000, F. pennsylvanica accounted for 41.77% of all street trees. However, the dominance by a particular street tree species or genus in Iowa can vary greatly by the city, and Fraxinus spp. make up over 50% of the street tree canopy in some Iowa cities (Iowa DNR 2025).
Because the 2008 to 2024 datasets contained inventory data for small, midsize, and large cities, this paper was able to assess tree diversity on the basis of city size for those datasets. Relative abundance percentages of prevalent street tree species and genera were found to be greatest for small cities and declined from small to midsize cities and from midsize to large cities (Table 4). Additionally, diversity statistics for all street tree species and genera, except for the evenness of street tree species, indicated that street tree diversity was lowest for small cities and increased from small cities to midsize cities and from midsize cities to large cities (Table 5). A diversity t-test confirmed that the differences in street tree diversity for city size were statistically significant (Table 6). Comparable findings for street tree diversity on the basis of city size cannot be made from the 1978 dataset because data were not collected for midsize and large cities. Wray and Jungst (1981) stated that a study similar to the one conducted for smaller cities in 1978 would be conducted for larger cities, but to the best of our knowledge this study for larger cities was not conducted.
This paper was also able to assess street tree age based on trunk diameter in the 2008 to 2024 datasets and make comparisons for city size. DBH distribution profiles for all street trees by city size showed distribution peaks for small and midsize cities in the 30.48 cm to 45.72 cm (12 in to 18 in) DBH size class, while larger cites showed a consistent descending trend line from small to large DBH size classes (Figure 3). These profiles suggest that small and midsize cities contained a greater percentage of older street trees relative to younger street trees than larger cities. Conversely, for the 40 small cities comprising the 1978 dataset, the DBH distribution profile for all street trees showed a descending trend line from the 0 cm to 7.62 cm (0 in to 3 in) DBH size class to the 15.24 cm to 30.48 cm (6 in to 12 in) DBH size class, followed by a peak in the 30.48 cm to 50.80 cm (12 in to 20 in) size class before descending again in the > 50.80 cm (> 20 in) size class (Figure 2). As stated above, Wray and Jungst (1981) believed that the large number of trees contained in the smallest DBH classes reflected a surge in the planting of trees following the removal of elms killed by DED. Davis (1993), in a longitudinal study of 22 communities in Kansas which had been inventoried 2 or 3 times over 20 years, likewise identified a surge in tree planting in the wake of DED as communities responded to dramatic street tree population losses that occurred in a relatively short period of time. However, Davis (1993) also stated that the surge in tree planting had not been sufficient to keep pace with tree mortality in many communities, which then resulted in aging street tree populations and greater maintenance costs. Wade and Kielbaso (2014) made a similar finding for 6 Midwestern United States cities where the average trunk diameter of publicly planted trees increased between 1980 and 2005, which they attributed to the cities not planting enough new trees. This paper identified for the 2008 to 2024 datasets a descending DBH profile for large Iowa cities that suggests a large number of new trees have been planted relative to the rest of the street tree population (Figure 3). It is beyond the scope of this paper to judge whether the number of new trees will be sufficient to keep pace with tree mortality or, if not, if aging street tree populations and increased maintenance costs will occur. However, peaks in the 30.48 cm to 45.72 cm (12 in to 18 in) DBH size class for small and midsize cities suggest that aging street tree populations will likely result over time and create greater maintenance costs for many of the inventoried cities.
This paper also assessed street tree condition in the 2008 to 2024 datasets and made comparisons by city size. Findings made for street tree condition were mixed. The percentage of trees in all cities receiving good condition wood ratings steadily declined as trunk diameter increased, consistent with the comment made by Wray and Mize (1985) that overall tree condition tended to deteriorate as trees aged and trunk diameter increased (Figure 4). However, the percentage of trees receiving good condition leaf ratings showed little if any decline as trunk diameter increased (Figure 5). Results for tree condition by city size were similarly mixed. Small cities were found to have the lowest percentage of trees receiving good condition wood ratings, and a modest increase was found for the percentage of trees receiving good condition wood ratings as city size increased. A similar relationship was not found for condition leaves and city size (Table 7).
The mixed findings for tree condition and city size are not surprising and may be due to dataset limitations. Data for tree diversity and trunk size are fairly straightforward to collect. For example, accurate trunk size data can be obtained using a measuring tape, although there is some inconsistency in how multi-stemmed trees are measured (Magarik et al. 2020). However, tree condition ratings involve percentage estimates which can involve more subjectivity than identifying tree species and determining trunk diameter (Gartner et al. 2002; Ma et al. 2021). This subjectivity can be further impacted by inter-operator variability if, as was the case for the 2008 to 2024 datasets, multiple individuals are involved in data collection over many years. Given potential issues associated with collecting tree condition data, perhaps more weight should be given to tree diversity and age when making findings for datasets comprised of multiple street tree inventories conducted at different periods of time, or perhaps more weight should be given to wood condition than to leaf condition. However, there is also the possibility that the inconsistencies in tree condition ratings are informative and suggest nuances in the data that require further study.
If results for tree condition are mixed, results for tree diversity and age appear more instructive and suggest work needs to be done to both increase tree diversity and plant new trees, especially in small cities. These objectives can be closely related. In the aftermath of DED when many trees needed to be planted to replace elms that had died, Wray and Mize (1985) were concerned about tree species selection and which trees were best suited as street trees in Iowa. High percentages of less frequently planted tree species, such as Q. macrocarpa (bur oak), Platanus occidentalis (American sycamore), and T. cordata (littleleaf linden) were found in the 1978 inventories to be in better condition relative to other tree species as trunk diameter increased. Wray and Mize (1985) therefore reasoned that these species were good candidates for street tree plantings that would not only diversify street tree populations but would also have greater survivability and therefore require less maintenance than other tree species, including many of the species most prevalent in the 1978 dataset. Selecting tree species for street tree planting with greater survivability and needing less maintenance was important for small cities because, as Wray and Jungst (1981) had found, small cities had limited financial resources and a lack of trained personnel dedicated to street tree management; tree maintenance was a low priority for city officials and typically occurred only in cases of severe need or when everything else needing to be done had been done.
When Wray and Mize (1985) evaluated tree species for street tree plantings, the EAB and bur oak blight (Tubakia spp.) had not yet become problems in Iowa, nor had the Asian longhorned beetle (ALB) (Anoplophora glabripennis) started threatening trees elsewhere in the United States. The ALB is especially worrisome because it is a polyphagous pest that has a preference for the tree species and genera it attacks but will attack multiple species and genera; therefore, the strategy of minimizing tree losses to an invasive pest by selectively planting some tree species and avoiding others may be ineffective (Laćan and McBride 2008). The ALB has yet to be found in Iowa (Iowa Department of Agriculture & Land Stewardship 2025), but it is a potentially serious threat to the state’s street tree population because it prefers trees in the Acer genus, and there is an overabundance in Iowa of Acer spp. street trees, particularly in the state’s small cities.
The IDNR similarly believes that there are too many Acer spp. street trees in Iowa and that the state’s street trees and trees growing on private property should be diversified. It has therefore created a guide for planting trees besides those in the Acer genus titled “Rethinking Maples: A Case for Cultivating Tomorrow’s Canopy” (Iowa DNR 2023). After stating that “maples make up more than one third of all tree in Iowa communities” and that “a diverse mix of trees is necessary for maintaining a healthy and resilient community forest,” the guide recommends 71 species besides Acer spp. for planting, both native and non-native to Iowa, including, as suggested by Wray and Mize (1985), Q. macrocarpa and P. occidentalis, which are native, and T. cordata, which is not. Other species contained in the guide include Q. ellipsoidalis (Northern pin oak), Q. muehlenbergii (chinkapin oak), and Q. shumardii (Shumard oak), as well as Aesculus glabra (Ohio buckeye), Liquidambar styraciflua (sweetgum), and Ostrya virginiana (hophornbeam). These species have been successfully planted as street trees in Iowa but not in large numbers. “Right tree, right place” guidance is also given to “homeowners and city staff” regarding species requirements and preferences for soil type, spacing, and sun versus shade exposure. This guidance is essential, not only because a tree species well-suited to site conditions is more likely to grow well and survive, but because this information may not be known by municipal officials responsible for planting decisions, especially in small and midsize cities. Only 11 Iowa cities employ a municipal forester and none with a population less than 23,982 (Hannigan 2025, personal communication; Iowa State Data Center 2025). Guidance is also given to select tree species resistant to storm damage. This topic is relevant in Iowa due to derechos, rapidly moving thunderstorms with damaging straight-line wind gusts at least 58 mph (93.3 kph) occurring over an area at least 250 mi (402.3 km) long that strike the state periodically (National Weather Service 2025). A derecho in August 2020 was particularly severe. In Cedar Rapids, Iowa’s second largest city, sustained winds of 70 mph (112.7 kph) and wind gusts up to 140 mph (225.3 kph) destroyed 18 percent of the city’s municipally managed trees (Jordan 2021; Confluence Inc. 2022).
Recommending both native and non-native tree species can also be important to increasing tree diversity. Because consumer preferences for commonly planted tree species are persistent (Simons and Hauer 2014) and nurseries tend to stock tree species which sell well and not less popular ones, underutilized tree species can be difficult to source (Sydnor et al. 2010; Conway and Vecht 2015). In fact, Iles and Vold (2003) found that Iowa nurseries overproduced, and Iowa landscape professionals specified, a disproportionately small number of tree species and cultivars. Therefore, although native tree species may be better adapted for local climates and offer better wildlife habitat (Conway et al. 2019), the choice of available tree species may be further reduced and diversifying tree populations made more difficult if native species are prioritized to the exclusion of non-native species (Sjöman et al. 2016).
Finally, while this paper’s findings for tree diversity and the overabundance of Acer spp. agree with the IDNR and its general recommendation to plant trees other than those belonging to the Acer genus, there are limitations with the datasets analyzed in this paper that should be acknowledged since they could potentially impact its findings. Of particular significance, and primarily in the inventories conducted by IDNR, is the large number of trees identified at only the genus level or not assigned to a species or genus. Many trees, following i-Tree protocols, were grouped as Broadleaf Deciduous Other, Coniferous Evergreen Other, etc., because their species were not contained in i-Tree’s Midwest tree list when the IDNR inventories were conducted. Examples include A. × freemanii (Freeman maple), which was inventoried as Acer spp.; Populus alba (white poplar) and P. grandidentata (big-tooth aspen), which were inventoried as Populus spp.; and Abies concolor (white fir) and Picea glauca (white spruce), which were inventoried as CEL OTHER (Conifer Evergreen Large) (Hannigan 2025, personal communication). Therefore, the diversity of species and genera contained in the IDNR dataset for small and midsize cities is almost certainly greater than can be reported based on the inventory data. In addition, given that some tree species such as A. × freemanii, P. alba, and P. grandidentata were grouped at the genus level rather than being accounted for at the species level, genus diversity is most likely a more accurate indicator of diversity than species diversity for small and midsize cities. However, even if the relative abundance of all Acer spp. in small cities is more accurately 40% than 42%, or in midsize cities is more accurately 38% than 40%, Acer spp. remain significantly over-represented in those street tree populations, and greater tree diversity is still warranted. The situation with Fraxinus spp. is more nuanced, since EAB has been present in Iowa since at least 2010 and has been confirmed in all of the state’s 99 counties (Iowa Department of Agriculture & Land Stewardship 2024). It is reasonable to assume that, given that large numbers of Fraxinus spp. have already been killed by the EAB and more will be killed in the future and that DBH distributions for all city sizes indicate few Fraxinus spp. are being planted, the over-representation of F. pennsylvanica in Iowa street tree populations, relatively minor compared to South Dakota, USA, will decline and at some point no longer be true.
Additional limitations in the data include the following. Cities inventoried in 1978 were randomly selected, but the cities inventoried between 2008 and 2024 were not; therefore, findings based on the 2008 to 2024 datasets could be vulnerable to selection bias and might not comprise a representative sample. However, the 2008 to 2024 datasets are comprised of a much larger number of cities and trees than the 1978 dataset, and a larger sample size is more likely to contain less variability and thereby lead to more accurate tree population estimates. The definitions of small cities based on population size also differ between the 1978 and 2008 to 2024 datasets, which creates some doubt about construct validity and the accuracy of comparisons made between the datasets for tree diversity, age, and condition in small cities. The 1978 dataset, unlike the 2008 to 2024 datasets, contains summary data only; this greatly limits the ability to rework the 1978 dataset and thereby enable, for example, comparisons to be made for tree diversity, age, and condition for small cities of equivalent population size. Lastly, the 1978 dataset only contains data for cities with populations of 10,000 or less; analyses comparable to those made for these cities cannot be made for cities with larger populations. By contrast, the 2008 to 2024 datasets contain individual data records for trees including data for midsize and large cities which facilitates comparisons to be made for variables of interest on the basis of city size.
Conclusion
More than 50 years have passed since Wray and Prestemon (1983) wrote that information about street tree management in Iowa’s small cities was negligible. The street tree inventories conducted in 1978 began providing that information, and the inventories conducted by IDNR advanced that process significantly. It needs to advance still further. This paper was able to make findings from the 2008 to 2024 datasets for street tree diversity, age, and condition on the basis of city size and to make limited comparisons with the 1978 dataset for small cities. It was unable to make statistically significant longitudinal findings for these variables in small cities to determine trends associated with them. The data required to do so, ideally from a randomly selected set of small cities geographically dispersed to account for variations in temperature and precipitation that are re-inventoried on a regular periodic basis, are not available. IDNR has started to re-inventory cities that had been inventoried previously, but it is unclear if data are being collected in a manner that will facilitate longitudinal analyses or if longitudinal analyses are a priority. The importance of making such findings has increased with climate change. Street trees are more vulnerable to increases in temperature, drought, and precipitation intensity due to already stressful streetscape conditions, and adaptability to climate change has become an important factor in assessing the health and survivability of street tree populations (Lohr et al. 2016) and the continued provision of the many benefits that street trees provide (Morgenroth et al. 2016). Brandt et al. (2021) have projected that increases in the number of hot days and in precipitation in the Upper Midwest due to climate change will likely modify the suitability of some tree species currently planted along streets and favor those tree species that are more heat and drought tolerant. Unfortunately, the need to re-inventory street trees to facilitate longitudinal analyses and more fully understand trends in street tree structure and composition with the impact of climate change corresponded in Iowa with a reduction in state government funding for natural resource management (Iowa DNR 2020). The ability of IDNR’s Urban and Community Forestry program to work with cities in the state to improve the sustainability of their urban tree resources has therefore depended increasingly on federal grants and partnerships with nonprofit organizations. However, recent events indicate that many federal grants supporting street tree management are in jeopardy of being reduced or eliminated. For example, a $630,000 USD grant awarded to Decorah, Iowa, in 2023 to fund tree trimming and pruning, new tree plantings, and a street tree inventory was cancelled in 2025 due to a nationwide federal funding freeze (Decorah News 2025).
When Wray and Jungst (1981) interviewed officials from the cities inventoried in 1978 and asked what type of assistance would encourage more street tree planting and maintenance, the primary response was that more financial assistance was needed. Similarly, in 2010, nearly 70% of respondents to a statewide survey of Iowa communities commissioned by Trees Forever, an Iowa nonprofit and volunteer-based tree planting organization, identified lack of funds as the most significant challenge in carrying out tree planting and tree care projects (Iowa State University 2010). Funding for street tree management continues to be an issue for Iowa’s small cities. Although IDNR provided a detailed 6 year tree management plan tailored to the budget resources of each inventoried community, finding funds to remove all Fraxinus spp. and hazardous trees and also maintain and prune existing trees has been difficult for many cities (Murrow 2025, personal communication). Since 67.7% of Iowa cities with a population of 5,000 or less in the 2020 US Census experienced a decline in population from the 2010 US Census (Iowa State Data Center 2025), it appears unlikely that the financial resources available to Iowa’s small cities for street tree management will increase substantially anytime soon. Despite this concern, the prognosis for street tree management in Iowa’s small cities seems more positive than in the early 1980s. Whereas Wray and Jungst (1981) found that street tree management plans were nonexistent in Iowa’s small cities, in 2024 IDNR reported that 352 of Iowa’s small cities had management plans (Iowa DNR 2024b). Wray and Jungst (1981) also found discrepancies between real tree maintenance needs and maintenance needs as perceived by city officials. For small cities where IDNR conducted inventories and developed management plans, city officials now have an accurate understanding of real tree maintenance needs. Even if funds are not available to act fully upon those plans, accurately understanding maintenance needs facilitates more efficient allocation of resources and increases the prospects for improvement in street tree health and condition. Wray and Prestemon (1983) additionally found that funding issues reduced tree planting. Beginning in 1989, the Iowa legislature required utilities doing business in the state to promote energy efficiency; subsidizing a tree planting program was one way a utility could meet this mandate, and many did and continue to do so (Vitosh and Thompson 2000). Iowa’s small cities have participated in these programs and benefitted from them, although the extent to which these programs have positively impacted their street tree populations is unclear.
Therefore, while this paper found in following up on the 3 papers written in the 1980s that Iowa’s small cities may still have some issues in managing their street trees as reflected in the findings made for tree diversity, age, and condition, it appears that progress is being made in addressing them, although the extent and pace of that progress cannot be fully ascertained due to a lack of data. Moving forward, IDNR’s Urban and Community Forestry program will hopefully have sufficient resources to continue assisting Iowa’s small cities in managing their street trees. The assistance to small cities seems especially warranted in a state characterized and in many ways defined by them so that these cities will be able to better manage their street trees and maintain if not increase the benefits these trees provide.
Conflicts of Interest
The author reported no conflicts of interest.
Acknowledgements
The author thanks E. Hannigan and C. Morrow, Iowa Department of Natural Resources, for graciously making available the IDNR street tree inventory data without which the paper could not have been written.